I'm currently doing a lot of normality tests and was using Shapiro-Wilk for my data. The problem is, that my data is discrete (likert-scaled from 0 to 5) and the grouping intervals exceed 0.1 of my standard deviation, so according to what I read Shapiro-Wilk is the wrong test.
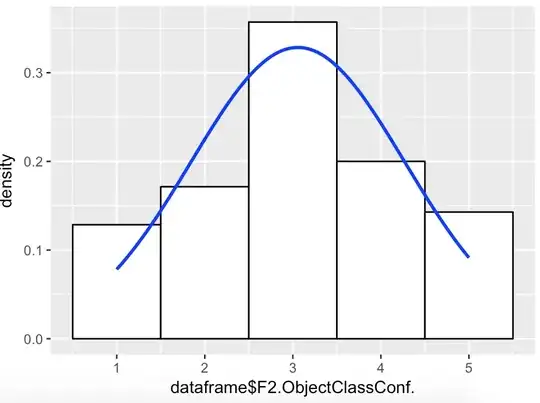
I used pearsons test in the nortest-package in R now, but it still rejects nearly everything, which seems weird to me (see example plot below: Histogram + Normal distribution as a blue line above the histogram). I read on Wikipedia that theres a so called Sheppard-Correction for Shapiro-Wilk when using tied values. Does anyone know a R-implementation of that and how it works?
My histogram looks normal to me, of course its still not continous so Shapiro-Wilk rejects it, but pearson.test also rejects it with P = 110.09, p-value < 2.2e-16.
