0

I am using Mathematica to model the distribution of the data below and I test the fits with AD, CVM and KS but none of them seems to work I was told that my data may have an excessive amount of ties. What kind of alternative tests that deal with such an issue ?

data = {0.180723, 0.181208, 0.182213, 0.1875, 0.1875, 0.1875, 0.1875,
0.1875, 0.1875, 0.190476, 0.191041, 0.19174, 0.192308, 0.192513, 
0.193038, 0.194118, 0.194858, 0.195172, 0.196141, 0.196507, 0.196911,
0.19717, 0.199725, 0.2, 0.2, 0.2, 0.2, 0.2, 0.2, 0.2, 0.2, 0.2,
0.204804, 0.204887, 0.206148, 0.207435, 0.208861, 0.211034, 0.213389,
0.214286, 0.214286, 0.214286, 0.215247, 0.218447, 0.22028, 0.221334,
0.221519, 0.222222, 0.224227, 0.224359, 0.225352, 0.226485, 0.230769,
0.230769, 0.230769, 0.230769, 0.230769, 0.230769, 0.231561, 0.23622,
0.239075, 0.24, 0.24, 0.241667, 0.241758, 0.246269, 0.247842, 0.25,
0.25, 0.25, 0.25, 0.25, 0.25, 0.25, 0.25, 0.25, 0.25, 0.25, 0.254902,
0.26087, 0.26087, 0.264706, 0.269461, 0.272727, 0.273684, 0.277778,
0.287576, 0.28934, 0.295775, 0.298013, 0.3, 0.3, 0.3, 0.3, 0.304124,
0.305085, 0.310345, 0.333333, 0.333333, 0.333333, 0.333333, 0.333333,
0.333333, 0.333333, 0.333333, 0.333333, 0.333333, 0.333333, 0.357143,
0.36, 0.375, 0.375, 0.375, 0.375, 0.375, 0.387097, 0.4, 0.409091,
0.409091, 0.5, 0.5, 0.6}
kjetil b halvorsen
  • 63,378
  • 26
  • 142
  • 467
  • What causes you to say that they don't work? – Kodiologist Jul 03 '17 at 03:02
  • 2
    @Kodiologist for the tests to be distribution free (and for the usual null distribution to apply) you need that the distributions are continuous. The impact for a few ties is not large but with lots of ties the test can be highly conservative (and have correspondingly low power). I imagine the mentioned software is providing a warning message. – Glen_b Jul 03 '17 at 05:40

1 Answers1

1

You should start with something simpler. Plotting a histogram (I read the data in R and plotted there, not shown) shows that this is not a normal distribution, it has to much right skew and could be closer to gamma.

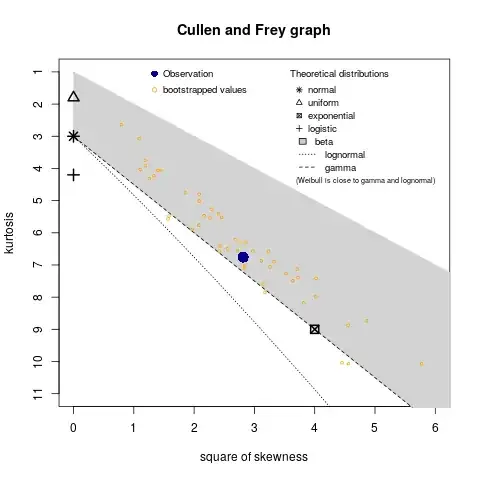
Now I continued with graphical methods, a so-called Cullen and Frey graph. I made that in R using the package fitdistrplus, some code and other examples at Is my data gamma distributed?

The resulting plot is here:

Cullen and Frey graph

The data is the big blue point, plotted in squared-skewness versus kurtosis space. The 5o yellow points are from bootstrapped resamples, showing the large variability in this data. The blue point is not too far from the line representing the gamma distribution family, so that could be a good start.

kjetil b halvorsen
  • 63,378
  • 26
  • 142
  • 467