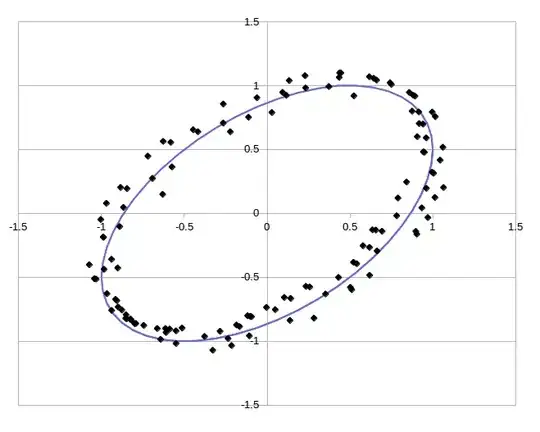
The scatter plot shows two data series (x,y) the are placed somehow around a tilted ellipse. This is in fact the way I have drawn this example plot.
Which statistics of the data sets are the most suitable to estimate back the geometrical parameters of the underlying ellipse? The objective is to have an ellipse that deviates the least from the points (perhaps considering distances in direction normal to the ellipse?). Such parameters could be the location of the centre, the lengths of the major and minor axes and, interestingly, the tilt with respect to the x axis.
 There are many mathematical representations for an ellipse -- using any that is amenable to a statistical interpretation would do.