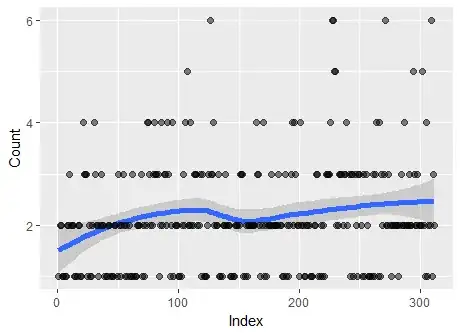
I'm a PhD stats student. I'm working with a data set of count data. It's counts of users who are involved in an n-way real time chat conversation. The # of users range from 1 to 6 and there are approx 300 pieces of data in the set.
My initial motivation was to understand if the data would fit a Poisson distribution, my thinking being if a good fit was found i could use this result for further inference.
To cut a long story short, I attempted to fit the data and the fit fails at a 0.05 significance level. Thus I can reject my hypothesis (that a Poisson distribution can be used to approximate the data set).
When i look at a density plot, i believe the reason why there is such a poor fit is that there are "too many recorded values for 2 users. A Poisson distribution would fit better with less values in this bin. However as i compiled the data myself I have no reason to believe there are outliers (i.e. conversations with 2 users which would be assigned to a higher or lower bin)
users <- c(1, 2, 2, 1, 1, 1, 1, 2, 2, 3, 2, 2, 2, 1, 1, 1, 2, 2, 1, 1, 4, 3, 3, 3, 1,
        2, 1, 1, 2, 4, 3, 2, 2, 1, 2, 3, 2, 2, 1, 1, 1, 2, 2, 1, 1, 1, 2, 2, 1, 3,
        2, 1, 2, 3, 2, 1, 2, 1, 2, 1, 1, 3, 1, 1, 1, 2, 2, 2, 3, 1, 2, 1, 2, 4, 4,
        3, 2, 2, 3, 4, 3, 3, 3, 1, 2, 4, 2, 3, 3, 2, 4, 3, 1, 2, 4, 1, 2, 2, 2, 1,
        1, 1, 2, 3, 2, 4, 5, 2, 2, 4, 2, 2, 3, 3, 3, 2, 2, 3, 1, 3, 1, 1, 1, 2, 3,
        6, 3, 3, 4, 2, 2, 2, 3, 1, 1, 1, 2, 2, 3, 2, 2, 2, 1, 1, 1, 1, 2, 2, 2, 2,
        3, 3, 3, 1, 1, 2, 1, 2, 2, 2, 2, 2, 2, 4, 3, 3, 2, 1, 2, 4, 1, 2, 1, 2, 2,
        2, 3, 2, 2, 2, 2, 2, 3, 2, 2, 1, 1, 3, 1, 2, 1, 2, 3, 4, 2, 4, 3, 2, 2, 1,
        4, 2, 2, 1, 1, 2, 2, 2, 1, 1, 1, 2, 2, 3, 3, 1, 1, 2, 1, 2, 1, 3, 3, 3, 3,
        4, 6, 6, 5, 5, 2, 2, 3, 3, 3, 2, 3, 3, 4, 2, 3, 1, 3, 3, 1, 3, 2, 1, 3, 3,
        2, 1, 3, 1, 3, 2, 1, 1, 1, 1, 3, 1, 3, 4, 1, 4, 1, 3, 2, 3, 6, 2, 2, 3, 2,
        1, 2, 2, 2, 2, 2, 1, 2, 3, 2, 2, 4, 2, 2, 2, 3, 2, 2, 5, 3, 2, 2, 3, 2, 2,
        2, 5, 2, 1, 4, 1, 2, 2, 6, 1, 3, 2)


tu.fit <- goodfit(users,type="poisson", method = "MinChisq")
summary(tu.fit)
 Goodness-of-fit test for poisson distribution

             X^2 df     P(> X^2)
Pearson 69.37891  5 1.379945e-13
At undergrad level statistics I was taught that count data can be modeled by a Poisson distribution, but they never taught what to do when count data do not fit.
I'm not tied to the premise that my count data should fit Poisson (or any other distribution for that matter). However, I wanted to explore the efficacy of whether I should transform my dataset and fit to another discrete distribution or try some other approach (KDE) instead. Or should I simply conclude that my data is not a good fit for Poisson (or any other distribution) and leave it at that?
