It seems to me that the main function of PCP is to highlight homogeneous groups of individuals, or conversely (in the dual space, by analogy with PCA) specific patterns of association on different variables. It produces an effective graphical summary of a multivariate data set, when there are not too much variables. Variables are automatically scaled to a fixed range (typically, 0–1) which is equivalent to working with standardized variables (to prevent the influence of one variable onto the others due to scaling issue), but for very high-dimensional data set (# of variables > 10), you definitely have to look at other displays, like fluctuation plot or heatmap as used in microarray studies.
It helps answering questions like:
- are there any consistent pattern of individual scores that may be explained by specific class membership (e.g. gender difference)?
- are there any systematic covariation between scores observed on two or more variables (e.g. low scores observed on variable $X_1$ is always associated to high scores on $X_2$)?
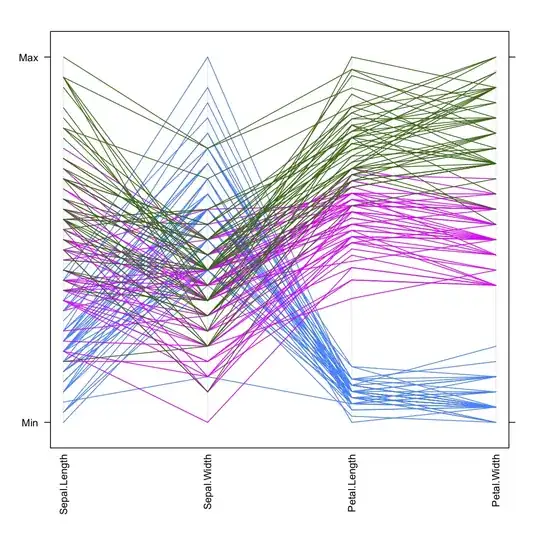
In the following plot of the Iris data, it is clearly seen that species (here shown in different colors) show very discriminant profiles when considering petal length and width, or that Iris setosa (blue) are more homogeneous with respect to their petal length (i.e. their variance is lower), for example.
You can even use it as a backend to classification or dimension reduction techniques, like PCA. Most often, when performing a PCA, in addition to reducing the features space you also want to highlight clusters of individuals (e.g. are there individuals who systematically score higher on some combination of the variables); this is usually down by applying some kind of hierarchical clustering on the factor scores and highlighting the resulting cluster membership on the factorial space (see the FactoClass R package).
It is also used in clustergrams (Visualizing non-hierarchical and hierarchical cluster analyses) which aims at examining how cluster allocation evolves when increasing the number of clusters (see also, What stop-criteria for agglomerative hierarchical clustering are used in practice?).
Such displays are also useful when linked to usual scatterplots (which by construction are restricted to 2D-relationships), this is called brushing and it is available in the GGobi data visualization system, or the Mondrian software.