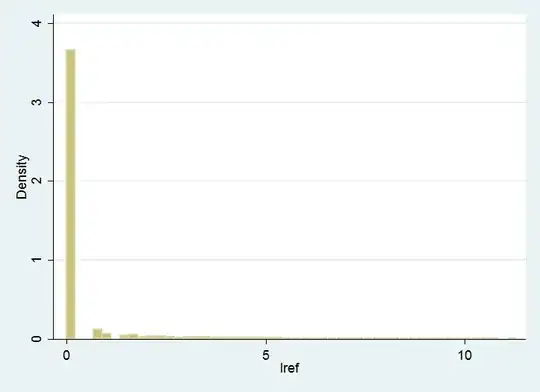
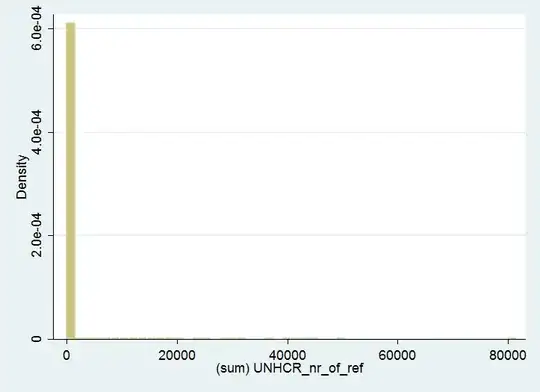
I would like to fit a model to a dependent variable distributed like the one below (see picture).
The distribution is a count of people (with specific characteristics) in various districts. This means that, there are no negative numbers; in the great majority of districts the variable is 0, but there also exists very large numbers (up to 80,000) with very low frequency.
Following Moti Nisenson's advice, I edit some graphs into this post that make the distribution clearer. If I drop all 0, the graph looks the same because there are a lot of 1's, 2's, etc.
If I drop all < 100, it looks like this:
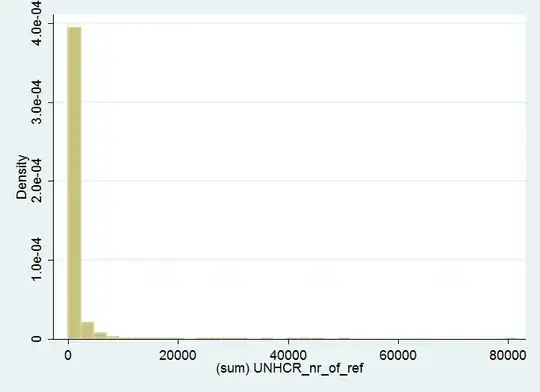
If I drop all < 1000, it looks like this:
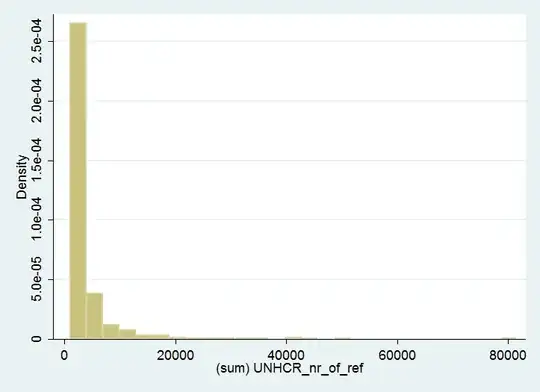
If I drop all < 5000 it looks like this:
My goal is to find a regression that does well in predicting the zeros and, more importantly, the extreme values in the right tail of the distribution.
I understand that Ordinary Least Squared is not ideal here. I have looked into Poisson regressions which seem to be a great deal more adequate for my purposes.
Is there any regression model that is even more appropriate? Which else options might be helpful?
Additional edit:
These are the summary stats. The Variance is much (much) higher than the mean which according to this source is a sign that Poisson is not appropriate.
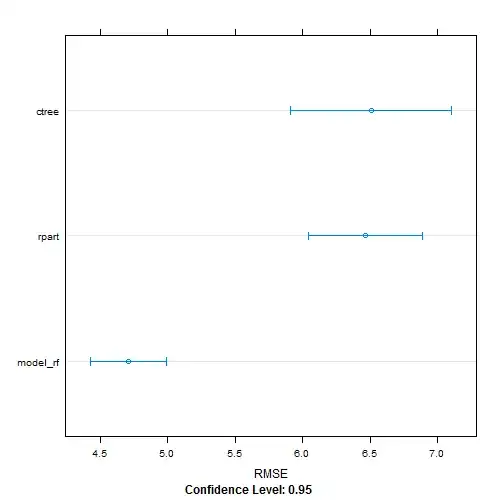
Additional edit 2: Here is the distribution of the variable in log as requested.