Please look at the following simple example of how to fit a GAM to a data set using one spline,
library("ggplot2")
theme_set(theme_bw())
library("mgcv")

df <- data.frame(one   = 1*(1:20),
                 two   = c(1,6,2,8,7,4,9,8,5,4, c(1,6,2,8,7,4,3,8,5,4)/2))
m <- gam(two ~ s(one, k = 8, pc=5), data = dfOne)

dev.off()
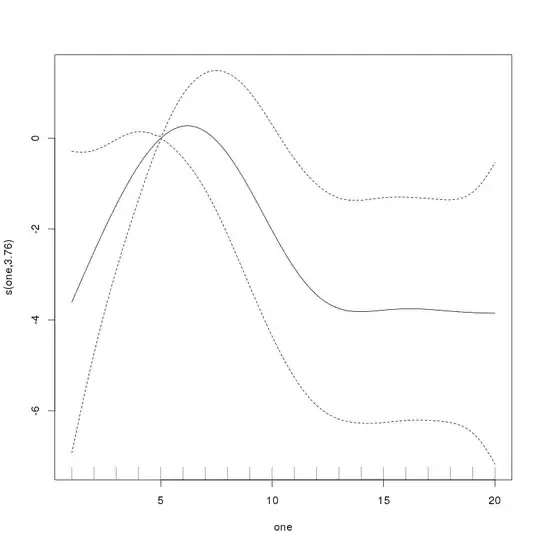
plot(m)
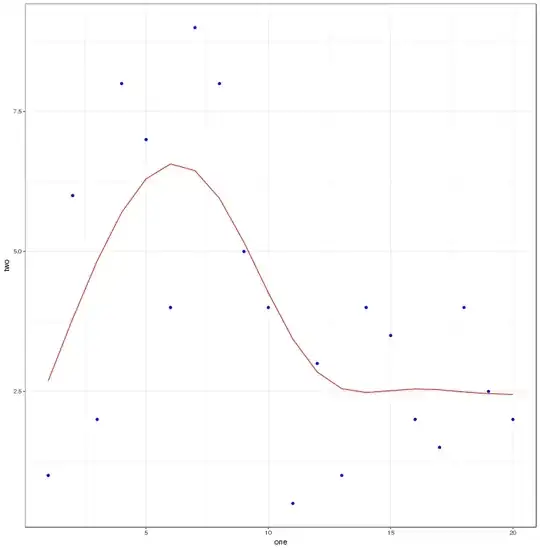
ggplot(dfOne, aes(x = one, y = two)) + geom_point(colour="blue") + geom_line(colour="red",aes(y=fitted(m))) + theme_bw()
The data and fit has the following form
while the spline takes the form
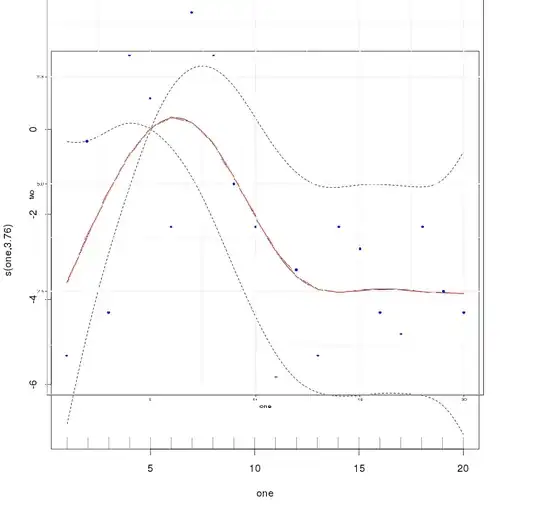
My question is very basic: What is the relationship between the estimated spline s(one) and the model in this simple example? Obviously they have the same shape, but when the estimated spline has value -3.78 at one=15, how is that related to the model's predicted value 2.51 at one=15? Is there a function that linkes these to values together?


