5

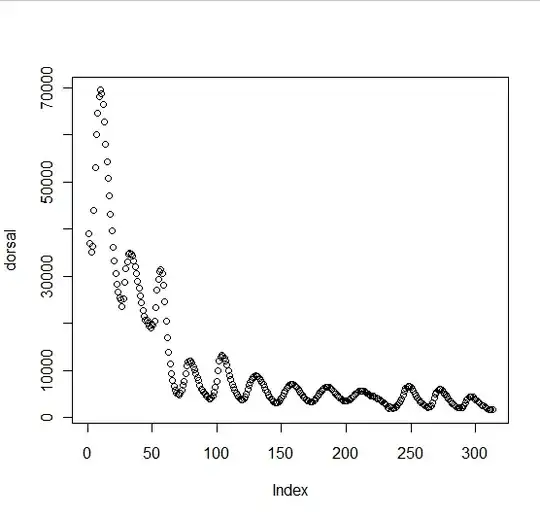
I have a signal, of varying amplitude, and after a certain point in time, I expect to see the period of this signal lengthen. I am looking for a way to measure the lengthening of this period.

Is this a way I can calculate the instantaneous period of the signal below, at any given point? For example, at index 220 I would expect the period to be roughly 40 units, whereas at index 50 I expect it to be 24 units.

I imagine the solution relates to either Fourier Transforms or Match Filtering, but I have little practical experience of either of these, so would appreciate any guidance. I am currently using R, but willing to consider other tools if they can help solve this problem.

Signal

Ina
  • 175
  • 1
  • 6
  • If you want a numerical answer it would help if you uploaded your data. You could post it inline too. – Emre Jun 07 '12 at 19:37

1 Answers1

2

As you probably already know, " Detecting the period of a signal with a length of only a few periods " is difficult.

Off the top of my head, there are several approaches you could use:

  • Use some sort of short-time Fourier transform, such as the Gabor transform. I hear rumors that library for doing Gabor transforms in the R language exists.b

  • If I were doing this "by hand" without a computer, I'd: Find the amplitude of each local max and local minimum (can be found much more precisely than the time of each local max and min). Find the midpoint-crossing-rising times Mt[n] where the amplitude of the function crosses precisely halfway between each local min and the following local max. Then I'd make a graph-of-estimated-periods where, for each consecutive midpoint-crossing times Mt[n] and Mt[n+1], I have a point x=average( Mt[n], Mt[n+1] ); y=estimated period (Mt[n+1] - Mt[n]) .

    • Doing this "by eye", the period of the cycle around 220 seems a lot wider than humps before and after it. Perhaps that's merely a fluke/noise. Perhaps you can get rid of most of the noise by somehow curve-fitting the graph-of-estimated-periods to some simple function.
  • The same thing with the midpoint-crossing-falling times, between each local max and the following local min. (I expect this to have about the same shape as the graph from the midpoint-crossing-rising times, but shifted slightly left or right in time).

  • Rather than using a model where frequency is slowly decreasing, perhaps we could model the signal as having only a single unchanging frequency, but somehow we're sampling at some non-uniform rate that slowly increases. (Are these two models mathematically equivalent?)

  • Perhaps it might be possible to do some nonlinear curve-fitting to find some complicated function that more-or-less directly matches your data.

David Cary
  • 241
  • 1
  • 3