Warning: the following answer contains controversial views about p-values and science.
To answer your question, yes, changing your metric after seeing the data can certain affect the true significance level of your test. But the purpose of science is not just the preservation of significance levels and I applaud the researchers for doing what they did. And I say this as someone who actively defends p-values.
(Note: I haven't actually read the linked paper as it is not loading on my computer for some reason. So to be precise, I'm actually defending what you said they did. Who knows, there may be damning details I'm missing.)
Why do I think the authors did the correct thing? Because while deciding how to model the data after seeing some of it may mean your p-values aren't uniformly distributed under the null hypothesis, not learning from your data can also be very stupid and wasteful. I very much approve of the fact that the researchers were upfront about their methodology (and deviations from protocols), which better allows the reader to know exactly how much that new p-value should be trusted.
As motivation, I will tell you of a time I did something very similar. I was called on a study in which we were to compare the learning rates between two groups of mice, with about 30 mice in each group. Each mouse was given a task and we observed either a success or failure. This was repeated 24 times. Basically, the difference in learning rates over time was the outcome of interest. We decided to use logistic GEE model account for the correlations between subjects, with the interaction between time and group being the coefficient of interest. Also note that at the first trial, the mice were literally picking at random so (at least theoretically) the intercept should be 0.
What did our data look like? I don't have access to it anymore, but I have simulated data that looks very much like what I saw:
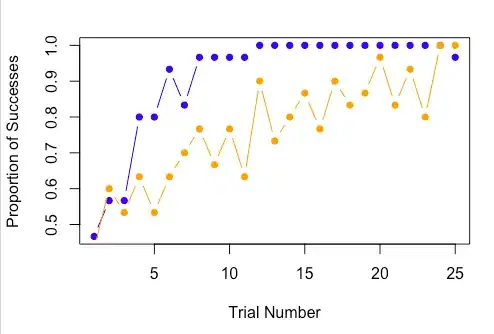
Given the sample sizes, I think it's pretty clear that the blue group is learning much faster than the orange group. Yet the p-value was 0.08 (of course)! Why? That very last observation. The problem here is that while the blue group learned extremely fast, I don't think the probabilities followed a linear logistic fit over time, but rather plateaued a little below 1. And, of course, that one 0 in the blue group showed up at the very worst time.
So what do we conclude about this? If all we care about is preserving $\alpha = 0.05$ rates, we conclude that we haven't seen enough evidence to conclude that the blue group learns faster than the orange group. But that's kind of an insane thing to do; I'm extremely convinced that the issue is that learning is not perfectly captured in a linear-logistic manner. To throw out an entire experiment (keep in mind that it took close to a year, I think, to raise the mice to the proper age) because we were incorrect about the very extreme ends of functional form (which we statisticians never 100% believe anyways) is an extremely crazy thing to do.
How did I address it this? I did report we started with a logistic GEE model according to our study plan and did get a p-value of 0.08. I then went on to explain that this was the result of a single mouse's decision at the end of the trial, which itself was merely a manifestation of the fact that the logistic model doesn't perfectly fit the data. I followed this up with a second analysis in which we did a permutation test and in such a case the p-value was < 0.0001.
Now does that final p-value have a uniform distribution under the null hypothesis? No. But should you believe we have enough evidence to decide that the blue group learns faster than the orange? I think so. And I've accurately presented all the evidence that I used to conclude this. To just reflexively say "but that p-value is not uniform(0,1) under the null, therefore your evidence is invalid!" is the much worse conclusion, at least to me.
