69

My question in the title is self explanatory, but I would like to give it some context.

The ASA released a statement earlier this week “on p-values: context, process, and purpose”, outlining various common misconceptions of the p-value, and urging caution in not using it without context and thought (which could be said just about any statistical method, really).

In response to the ASA, professor Matloff wrote a blog post titled: After 150 Years, the ASA Says No to p-values. Then professor Benjamini (and I) wrote a response post titled It’s not the p-values’ fault – reflections on the recent ASA statement. In response to it professor Matloff asked in a followup post:

What I would like to see [... is] — a good, convincing example in which p-values are useful. That really has to be the bottom line.

To quote his two major arguments against the usefulness of the $p$-value:

  1. With large samples, significance tests pounce on tiny, unimportant departures from the null hypothesis.

  2. Almost no null hypotheses are true in the real world, so performing a significance test on them is absurd and bizarre.

I am very interested in what other crossvalidated community members think of this question/arguments, and of what may constitute a good response to it.

amoeba
  • 93,463
  • 28
  • 275
  • 317
Tal Galili
  • 19,935
  • 32
  • 133
  • 195
  • 5
    Notice another two threads related to this topic: https://stats.stackexchange.com/questions/200500/asa-discusses-limitations-of-p-values-what-are-the-alternatives and https://stats.stackexchange.com/questions/200745/how-much-do-we-know-about-p-hacking-in-the-wild – Tim Mar 11 '16 at 11:56
  • 2
    Thanks Tim. I suspect my question is different enough that it deserves its own thread (especially since it was not answered in the two you mentioned). Still, the links are very interesting! – Tal Galili Mar 11 '16 at 12:10
  • 3
    It deserves and is interesting (hence my +1), I provided the links just FYI :) – Tim Mar 11 '16 at 12:16
  • 3
    I must say that I have not (yet) read what Matloff wrote on the topic, but still, in order for your question to stand on its own, can you perhaps briefly summarize why he finds any standard example of p-values usage not "good/convincing"? E.g. somebody wants to study if a certain experimental manipulation changes animal behavior in a particular direction; so an experimental and a control groups are measured and compared. As a reader of such a paper, I am happy to see the p-value (i.e. they are useful for me), because if it's large then I don't need to pay attention. This example is not enough? – amoeba Mar 11 '16 at 13:14
  • 1
    @amoeba - he lists them here: https://matloff.wordpress.com/2016/03/07/after-150-years-the-asa-says-no-to-p-values/ ----- Quoting his arguments: 1) with large samples, significance tests pounce on tiny, unimportant departures from the null hypothesis. 2) Almost no null hypotheses are true in the real world, so performing a significance test on them is absurd and bizarre. ----- I have my own take on these (which I would like to later formalize), but I am sure others will have insightful ways of answering this. – Tal Galili Mar 11 '16 at 13:35
  • 1
    Just to say - my response to them would be that if a researcher has a number in mind that would have scientific value, he could set H0 with a parameter to the boundary of that number. one could adjust the H0 to whatever threshold of a value that detecting it would offer scientific value. But I believe there are probably better ways to describe and illustrate what I wrote (as well as possible other arguments I haven't thought of). – Tal Galili Mar 11 '16 at 13:42
  • 1
    Tal, please see http://stats.stackexchange.com/questions/108911/why-does-frequentist-hypothesis-testing-become-biased-towards-rejecting-the-null and my answer which, to my mind, more or less demolishes the first argument (i.e. testing *only* for difference is committing to confirmation bias), and is unnecessary when we can both for *difference*, and for *equivalence*. – Alexis Mar 11 '16 at 21:28
  • 1
    @TalGalili And, on further reflection, *relevance testing* (combining tests for difference and tests for equivalence) also answers his second argument, because it explicitly injects both power and effect size directly into the conclusions drawn from the test. – Alexis Mar 11 '16 at 21:40
  • 1
    Your second claim is not true when we are checking balance in randomized experiments. If we randomized properly, then we know that the null hypothesis is true.. But there's definitely a reason why we still do balance checks, even when we control the randomization; that is, to check if there was a 'bad' randomization.. one that gives us imbalanced covariates that would lead us to think the causal estimate is at risk. –  Mar 12 '16 at 05:53
  • If $\theta$ is a parameter that represents an effect of interest, then for a test of $H_0: \theta=0$ vs $H_A: \theta \neq 0$, I agree with Matloff. I agree with those who have said that a test of $H_0: |\theta| \leq c$ vs $H_A: |\theta| > c$ can be useful, but it appears that Matloff's comments are referring to tests of the first type. – mark999 Mar 13 '16 at 00:57
  • @mark999 "it appears that Matloff's comments are referring to tests of the first type." so do you only admit as valid argument positions that agree with Matloff? Equivalence tests produce *p*-values. Matloff (and ASA) are not restricting their excoriation of *p*-values to specific tests, although they may be unaware that restricting use of *p*-values *only* to tests for difference is **implicitly demanding that *p*-value use incorporates confirmation bias (i.e. not looking for evidence against a position), thereby leading to the very inferential quandaries being complained about.** – Alexis Mar 21 '16 at 19:36
  • @Alexis No, I don't consider positions that disagree with Matloff to be invalid just because they disagree with Matloff. – mark999 Mar 22 '16 at 06:57
  • There is some discussion of this thread on Gelman's blog here: http://andrewgelman.com/2016/06/09/good-mediocre-and-bad-p-values/. – amoeba Jun 15 '16 at 23:01

8 Answers8

44

I will consider both Matloff's points:

  1. With large samples, significance tests pounce on tiny, unimportant departures from the null hypothesis.

    The logic here is that if somebody reports highly significant $p=0.0001$, then from this number alone we cannot say if the effect is large and important or irrelevantly tiny (as can happen with large $n$). I find this argument strange and cannot connect to it at all, because I have never seen a study that would report a $p$-value without reporting [some equivalent of] effect size. Studies that I read would e.g. say (and usually show on a figure) that group A had such and such mean, group B had such and such mean and they were significantly different with such and such $p$-value. I can obviously judge for myself if the difference between A and B is large or small.

    (In the comments, @RobinEkman pointed me to several highly-cited studies by Ziliak & McCloskey (1996, 2004) who observed that the majority of the economics papers trumpet "statistical significance" of some effects without paying much attention to the effect size and its "practical significance" (which, Z&MS argue, can often be minuscule). This is clearly bad practice. However, as @MatteoS explained below, the effect sizes (regression estimates) are always reported, so my argument stands.)

  2. Almost no null hypotheses are true in the real world, so performing a significance test on them is absurd and bizarre.

    This concern is also often voiced, but here again I cannot really connect to it. It is important to realize that researchers do not increase their $n$ ad infinitum. In the branch of neuroscience that I am familiar with, people will do experiments with $n=20$ or maybe $n=50$, say, rats. If there is no effect to be seen then the conclusion is that the effect is not large enough to be interesting. Nobody I know would go on breeding, training, recording, and sacrificing $n=5000$ rats to show that there is some statistically significant but tiny effect. And whereas it might be true that almost no real effects are exactly zero, it is certainly true that many many real effects are small enough to be detected with reasonable sample sizes that reasonable researchers are actually using, exercising their good judgment.

    (There is a valid concern that sample sizes are often not big enough and that many studies are underpowered. So perhaps researchers in many fields should rather aim at, say, $n=100$ instead of $n=20$. Still, whatever the sample size is, it puts a limit on the effect size that the study has power to detect.)

    In addition, I do not think I agree that almost no null hypotheses are true, at least not in the experimental randomized studies (as opposed to observational ones). Two reasons:

    • Very often there is a directionality to the prediction that is being tested; researcher aims to demonstrate that some effect is positive $\delta>0$. By convention this is usually done with a two-sided test assuming a point null $H_0: \delta=0$ but in fact this is rather a one-sided test trying to reject $H_0: \delta<0$. (@CliffAB's answer, +1, makes a related point.) And this can certainly be true.

    • Even talking about the point "nil" null $H_0: \delta=0$, I do not see why they are never true. Some things are just not causally related to other things. Look at the psychology studies that are failing to replicate in the last years: people feeling the future; women dressing in red when ovulating; priming with old-age-related words affecting walking speed; etc. It might very well be that there are no causal links here at all and so the true effects are exactly zero.

Himself, Norm Matloff suggests to use confidence intervals instead of $p$-values because they show the effect size. Confidence intervals are good, but notice one disadvantage of a confidence interval as compared to the $p$-value: confidence interval is reported for one particular coverage value, e.g. $95\%$. Seeing a $95\%$ confidence interval does not tell me how broad a $99\%$ confidence interval would be. But one single $p$-value can be compared with any $\alpha$ and different readers can have different alphas in mind.

In other words, I think that for somebody who likes to use confidence intervals, a $p$-value is a useful and meaningful additional statistic to report.


I would like to give a long quote about the practical usefulness of $p$-values from my favorite blogger Scott Alexander; he is not a statistician (he is a psychiatrist) but has lots of experience with reading psychological/medical literature and scrutinizing the statistics therein. The quote is from his blog post on the fake chocolate study which I highly recommend. Emphasis mine.

[...] But suppose we're not allowed to do $p$-values. All I do is tell you "Yeah, there was a study with fifteen people that found chocolate helped with insulin resistance" and you laugh in my face. Effect size is supposed to help with that. But suppose I tell you "There was a study with fifteen people that found chocolate helped with insulin resistance. The effect size was $0.6$." I don't have any intuition at all for whether or not that's consistent with random noise. Do you? Okay, then they say we’re supposed to report confidence intervals. The effect size was $0.6$, with $95\%$ confidence interval of $[0.2, 1.0]$. Okay. So I check the lower bound of the confidence interval, I see it’s different from zero. But now I’m not transcending the $p$-value. I’m just using the p-value by doing a sort of kludgy calculation of it myself – “$95\%$ confidence interval does not include zero” is the same as “$p$-value is less than $0.05$”.

(Imagine that, although I know the $95\%$ confidence interval doesn’t include zero, I start wondering if the $99\%$ confidence interval does. If only there were some statistic that would give me this information!)

But wouldn’t getting rid of $p$-values prevent “$p$-hacking”? Maybe, but it would just give way to “d-hacking”. You don’t think you could test for twenty different metabolic parameters and only report the one with the highest effect size? The only difference would be that p-hacking is completely transparent – if you do twenty tests and report a $p$ of $0.05$, I know you’re an idiot – but d-hacking would be inscrutable. If you do twenty tests and report that one of them got a $d = 0.6$, is that impressive? [...]

But wouldn’t switching from $p$-values to effect sizes prevent people from making a big deal about tiny effects that are nevertheless statistically significant? Yes, but sometimes we want to make a big deal about tiny effects that are nevertheless statistically significant! Suppose that Coca-Cola is testing a new product additive, and finds in large epidemiological studies that it causes one extra death per hundred thousand people per year. That’s an effect size of approximately zero, but it might still be statistically significant. And since about a billion people worldwide drink Coke each year, that’s a ten thousand deaths. If Coke said “Nope, effect size too small, not worth thinking about”, they would kill almost two milli-Hitlers worth of people.


For some further discussion of various alternatives to $p$-values (including Bayesian ones), see my answer in ASA discusses limitations of $p$-values - what are the alternatives?

Scortchi - Reinstate Monica
  • 27,560
  • 8
  • 81
  • 248
amoeba
  • 93,463
  • 28
  • 275
  • 317
  • 1
    Your response to the second argument misses the point, in my opinion. No one is suggesting that real researchers increase their sample sizes ad infinitum. The point (as I see it) is that any null hypothesis of the form "effect = 0" that a researcher would be interested in testing is going to be false, and there's little value in performing a hypothesis test if the null hypothesis is already known to be false. This of course assumes that what we are really interested in is the relevant population parameter(s), rather than the characteristics of the sample. – mark999 Mar 11 '16 at 21:53
  • 1
    But I admit that "any null hypothesis ... is going to be false" is only an assumption. – mark999 Mar 11 '16 at 21:56
  • I probably did not formulate my response very well; I will think how to clarify it. But I did try to address exactly this point. As I said: even if I admit that the true effect is never precisely zero, I still see value in a hypothesis test to reject effect=0 in a situation with a reasonable sample size. Having a "reasonable" sample size will (usually) not allow to reject the null if the real effect is tiny, so it actually corresponds to some "reasonable" minimally-interesting effect. (In fact, this is formalized in the Neyman-Pearson testing framework with its focus on power.) – amoeba Mar 11 '16 at 22:04
  • How do you define "reasonable" sample size? If you define it as, say, the sample size that gives 80% power for your minimally-interesting effect size, then you're still more likely than not (i.e. power > 50%) to reject the null hypothesis for some values of the true effect size that are uninteresting. – mark999 Mar 11 '16 at 23:10
  • That is a good point, thanks. I have to think about it. – amoeba Mar 11 '16 at 23:12
  • 1
    I should admit that my reasoning here was rather informal and I never tried to formalize it. Perhaps to make this argument work, I should not say that there is a clear boundary between interesting and uninteresting effect sizes. Rather it is a continuum with interestingness increasing further away from zero, and the "reasonable" sample size should give small power to the very uninteresting effect sizes and large power to the very interesting ones, but there is no one threshold. I wonder if one can accurately formalize it along the Neyman-Pearson lines. – amoeba Mar 11 '16 at 23:22
  • Could you please clarify what you mean by "effect size"? Suppose we're considering a two-sample t-test. Using self-explanatory notation, by "effect size" do you mean $|\mu_2 - \mu_1|/\sigma$ or do you mean $|\mu_2 - \mu_1|$? – mark999 Mar 11 '16 at 23:36
  • 7
    Maybe *you* "have never seen a study that would report a $p$-value without reporting [some equivalent of] effect size", but Ziliak and McCloskey found some 300 such papers published in just one journal, The American Economic Review, during just two decades. Such papers made up *more than 70%* of all the papers they looked at. – Robin Ekman Mar 12 '16 at 15:24
  • @Robin: Thanks. I don't know anything about economics and didn't encounter Z&MC's work before. I have now found their highly-cited 1996 & 2004 papers and took a brief look. I think I will update my answer but let me clarify. Are Z&MC really saying that 70% of the papers set up some regressions, stated as the main conclusion of the study that a particular coefficient of interest is significant, but *did not mention/report the size of this coefficient*? This is so preposterous that I find it hard to believe! What use is a model if none of the readers can apply it to or compare it with anything? – amoeba Mar 12 '16 at 21:43
  • @mark999: The former. But I don't see why it matters here: we can discuss a case when $\sigma=1$. – amoeba Mar 12 '16 at 21:48
  • @amoeba what Z&MC show is that the criterion for *relevance* of a result in empirical economics is often (mistakenly) equated with statistical significance. The coefficient estimates are always reported, as one would expect, but the emphasis is put on statistical significance. – MatteoS Mar 13 '16 at 13:29
  • @Robin: Z&MC claim that 70% of papers published on the American Economic Review, in commenting regression results, failed to properly distinguish between statistical significance and “economic significance” (i.e., magnitude of the coefficient, in most cases). At no point do they suggest that the papers in question *fail to report* those coefficient at all. – MatteoS Mar 13 '16 at 13:57
  • @MatteoS: This would make more sense, but I am not sure you are correct, see Table 1 in [the 1996 Z&MC paper](http://ww.deirdremccloskey.com/docs/pdf/Article_189.pdf), question #2 about descriptive statistics. And later in the text: "69 percent did not report descriptive statistics-the means of the regression variables, for example-that would allow the reader to make a judgment about the economic significance of the results". Please do correct me if I am wrong: I only saw this paper yesterday for the first time, and I did not carefully read it all either. – amoeba Mar 13 '16 at 17:23
  • @amoeba By “descriptive statistics” they mean the *unit of measurement* of the variables in questions and their *means* [prior to the regression analysis], as per point 2 on p. 102. This is important, but quite different from reporting the *coefficients of the regression*. To see this, consider point 5: “Are coefficients carefully interpreted?”: the discussion is not whether they are reported or not (they are), but if their magnitude is discussed appropriately, besides their statistical significance. – MatteoS Mar 13 '16 at 17:34
  • @MatteoS: Hmm. Thanks. So there is no explicit assertion in the Z&MC paper about what fraction of papers in their sample reported the regression coefficients, because it's implicitly assumed as evident that all (or perhaps almost all) papers did report it? I find this very strange, it goes against their whole rhetoric. Why didn't they simply include this explicit question in their list? – amoeba Mar 13 '16 at 17:38
  • 1
    @amoeba There is no such assertion as far as I understood. As you have noted in your question, the whole notion that the coefficients wouldn't be reported is preposterous. I think this is the reason this point wasn't included in the “best practices” list by Z&MC. (Moreover, I would be extremely surprised to find even a single paper in the AER that omitted to publish the coefficients in an empirical analysis). – MatteoS Mar 13 '16 at 17:45
  • 3
    @amoeba: the source of the 70% claim may be the ambiguous phrasing in the 2006 abstract: “of the 182 full-length papers published in the 1980s in the [AER] 70% did not distinguish economic from statistical significance”. What they mean by this–as explained in both papers–is that often only the latter is commented upon, and that the magnitude of the regression coefficient in relation to the dependent variable (“economic significance” in their jargon) is not as extensively analyzed. But it is always reported. I suggest you edit your update in the answer to reflect that :-) – MatteoS Mar 13 '16 at 17:50
  • "about a billion people worldwide drink Coke each year". Depressing if true, but maybe that was just a made-up statistic. – Faheem Mitha Apr 05 '16 at 15:07
29

I take great offense at the following two ideas:

  1. With large samples, significance tests pounce on tiny, unimportant departures from the null hypothesis.

  2. Almost no null hypotheses are true in the real world, so performing a significance test on them is absurd and bizarre.

It is such a strawman argument about p-values. The very foundational problem that motivated the development of statistics comes from seeing a trend and wanting to know whether what we see is by chance, or representative of a systematic trend.

With that in mind, it is true that we, as statisticians, do not typically believe that a null-hypothesis is true (i.e. $H_o: \mu_d = 0$, where $\mu_d$ is the mean difference in some measurement between two groups). However, with two sided tests, we don't know which alternative hypothesis is true! In a two sided test, we may be willing to say that we are 100% sure that $\mu_d \neq 0$ before seeing the data. But we do not know whether $\mu_d > 0$ or $\mu_d < 0$. So if we run our experiment and conclude that $\mu_d > 0$, we have rejected $\mu_d = 0$ (as Matloff might say; useless conclusion) but more importantly, we have also rejected $\mu_d < 0$ (I say; useful conclusion). As @amoeba pointed out, this also applies to one sided test that have the potential to be two sided, such as testing whether a drug has a positive effect.

It's true that this doesn't tell you the magnitude of the effect. But it does tell you the direction of the effect. So let's not put the cart before the horse; before I start drawing conclusions about the magnitude of the effect, I want to be confident I've got the direction of the effect correct!

Similarly, the argument that "p-values pounce on tiny, unimportant effects" seems quite flawed to me. If you think of a p-value as a measure of how much the data supports the direction of your conclusion, then of course you want it to pick up small effects when the sample size is large enough. To say this means they are not useful is very strange to me: are these fields of research that have suffered from p-values the same ones that have so much data they have no need to assess the reliability of their estimates? Similarly, if your issues is really that p-values "pounce on tiny effect sizes", then you can simply test the hypotheses $H_{1}:\mu_d > 1$ and $H_{2}: \mu_d < -1$ (assuming you believe 1 to be the minimal important effect size). This is done often in clinical trials.

To further illustrate this, suppose we just looked at confidence intervals and discarded p-values. What is the first thing you would check in the confidence interval? Whether the effect was strictly positive (or negative) before taking the results too seriously. As such, even without p-values, we would informally be doing hypothesis testing.

Finally, in regards to the OP/Matloff's request, "Give a convincing argument of p-values being significantly better", I think question is a little awkward. I say this because depending on your view, it automatically answers itself ("give me one concrete example where testing a hypothesis is better than not testing them"). However, a special case that I think is almost undeniable is that of RNAseq data. In this case, we are typically looking at the expression level of RNA in two different groups (i.e. diseased, controls) and trying to find genes that are differentially expressed in the two groups. In this case, the effect size itself is not even really meaningful. This is because the expression levels of different genes vary so wildly that for some genes, having 2x higher expression doesn't mean anything, while on other tightly regulated genes, 1.2x higher expression is fatal. So the actual magnitude of the effect size is actually somewhat uninteresting when first comparing the groups. But you really, really want to know if the expression of the gene changes between the groups and direction of the change! Furthermore, it's much more difficult to address the issues of multiple comparisons (for which you may be doing 20,000 of them in a single run) with confidence intervals than it is with p-values.
Cliff AB
  • 17,741
  • 1
  • 39
  • 84
  • 2
    I disagree that knowing the direction of the effect is *in itself* useful. If I spit on the ground, I know this *will* either improve or inhibit plant growth (i.e. the null hypothesis of no effect is false). How is knowing the direction of this effect without *any* information on its magnitude helpful? Yet this is the *only* thing the *p*-value from your two-sided test / two one-sided tests (sort of) tells you! (BTW, I think the ‘spit on the ground’ example was borrowed from some paper on *p*-values I read years ago, but I can’t recall which one.) – Karl Ove Hufthammer Mar 12 '16 at 17:48
  • 3
    @KarlOveHufthammer: Cart before the horse. I shouldn't stop just because I know the direction of the effect. But I should care that I have the direction correct before I start worrying about the magnitude. Do you think the scientific community would be better off by embracing everything with large estimated effects without checking p-values? – Cliff AB Mar 12 '16 at 18:27
  • 3
    Furthermore, this idea that "p-values don't give you useful information" is just sloppy use of hypothesis testing. You can easily test the hypotheses of $H_a: \mu_d > 1$ and $H_a: \mu_d < -1$ if you think an effect size must be of magnitude greater than 1 to be in anyway meaningful. (edited the answer to reflect this, as I believe it is an important point. Thanks for bringing it up) – Cliff AB Mar 12 '16 at 18:38
  • 2
    You made several very good points in the edits. I really like your answer now! – amoeba Mar 12 '16 at 21:34
  • If I'm understanding your RNAseq example, it seems like the reason we don't care about the effect size is that the experiment is, in some sense, structured backward. We'd actually like to know, for each gene, whether a higher (or lower) level of expression contributes to the disease, and if so, we *do* want to know the effect size (since some genes have a lot of impact and some have very little). But by taking the disease as the *independent* variable and a potential cause as the *dependent* variable, we get an uninteresting effect size ("cause size"?), so we're stuck with just *p*-values. – ruakh Mar 13 '16 at 05:33
  • 1
    @ruakh: actually, we readily admit that we are not necessarily looking for *causes*, but associations. In fact, we usually expect gene expression to be in response to the disease, and not vice-versa. Gene expression is not whether you have the gene or not, but how much RNA is made from that gene (i.e. did the gene get activated?) – Cliff AB Mar 13 '16 at 05:45
  • I also wanted to mention eQTL analysis and GWAS. Correct me if I am wrong, but there is no other way to make findings in this types of analysis. – German Demidov Mar 13 '16 at 22:08
  • 3
    While working on my answer to http://stats.stackexchange.com/questions/200500 I came across [this recent preprint by Wagenmakers et al](http://www.ejwagenmakers.com/inpress/MarsmanWagenmakersOneSidedPValue.pdf) where they essentially argue your point about directionality: "one-sided P values can be given a Bayesian interpretation as an approximate test of direction, that is, a test of whether a latent effect is negative or positive." It's interesting because Wagenmakers is a die-hard Bayesian, he wrote a lot against p-values. Still, I see some conceptual agreement here. – amoeba Mar 15 '16 at 11:59
  • 1
    (+1) In addition you can often also investigate the direction of an effect while postponing a decision about how exactly its magnitude should be parametrized. – Scortchi - Reinstate Monica Mar 29 '16 at 20:16
  • Nice discussion. It's amazing to me how often the "all null hypotheses are false" argument is used when the counter argument that a significant difference allows a confident conclusion about the direction of the effect has been known for so long. The oldest reference I know is to a Multivariate book by Bock in 1975 although I'm sure there are older ones. Tukey presents the argument very well here: https://projecteuclid.org/download/pdf_1/euclid.ss/1177011945 – David Lane Apr 20 '17 at 03:42
7

Forgive my sarcasm, but one obvious good example of the utility of p-values is in getting published. I had one experimenter approach me for producing a p-value... he had introduced a transgene in a single plant to improve growth. From that single plant he produced multiple clones and chose the largest clone, an example where the entire population is enumerated. His question, the reviewer wants to see a p-value that this clone is the largest. I mentioned that there is not any need for statistics in this case as he had the entire population at hand, but to no avail.

More seriously, in my humble opinion, from an academic perspective i find these discussion interesting and stimulating, just like the frequentist vs Bayesian debates from a few years ago. It brings out the differing perspectives of the best minds in this field and illuminates the many assumptions/pitfalls associated with the methodology thats not generally readily accesible.

In practice, I think that rather than arguing about the best approach and replacing one flawed yardstick with another, as has been suggested before elsewhere, for me it is rather a revelation of an underlying systemic problem and the focus should be on trying to find optimal solutions. For instance, one could present situations where p-values and CI complement each other and circumstance wherein one is more reliable than the other. In the grand scheme of things, I understand that all inferential tools have their own shortcomings which need to be understood in any application so as to not stymie progress towards the ultimate goal.. the deeper understanding of the system of study.

6

I'll give you the exemplary case of how p-values should be used and reported. It's a very recent report on the search of a mysterious particle on Large Hadron Collider(LHC) in CERN.

A few months ago there was a lot of excited chatter in high energy physics circles about a possibility that a large particle was detected on LHC. Remember this was after Higgs boson discovery. Here's the excerpt from the paper "Search for resonances decaying to photon pairs in 3.2 fb−1 of p p collisions at √s = 13 TeV with the ATLAS detector" by The ATLAS Collaboration Dec 15 2015 and my comments follow:

enter image description here

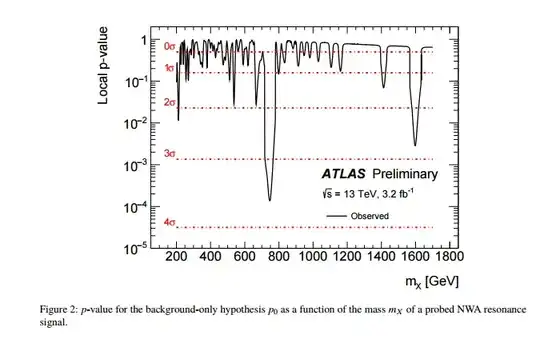
What they're saying here is that the event counts exceed what the Standard Model predicts. The Figure below from the paper shows the p-values of excess events as a function of a mass of a particle. You see how p-value dives around 750 GeV. So, they're saying that there's a possibility that a new particle is detected with a mass equal to 750 Giga eV. The p-values on the figure are calculated as "local". The global p-values are much higher. That's not important for our conversation though.

What's important is that p-values are not yet "low enough" for physicists to declare a find, but "low enough" to get excited. So, they're planning to keep counting, and hoping that that p-values will further decrease.

enter image description here

Zoom a few months forward to Aug 2016, Chicago, a conference on HEP. There was a new report presented "Search for resonant production of high mass photon pairs using 12.9 fb−1 of proton-proton collisions at √ s = 13 TeV and combined interpretation of searches at 8 and 13 TeV" by The CMS Collaboration this time. Here's the excerpts with my comments again:

enter image description here

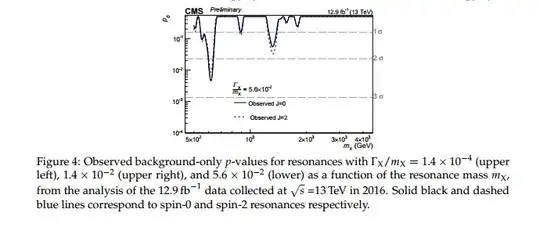
So, the guys continued collecting events, and now that blip of excess events at 750 GeV is gone. The figure below from the paper shows p-values, and you can see how p-value increased compared to the first report. So, they sadly conclude that no particle is detected at 750 GeV.

enter image description here

I think this is how p-values are supposed to be used. They totally make a sense, and they clearly work. I think the reason is that frequentist approaches are inherently natural in physics. There's nothing subjective about particle scattering. You collect a a sample large enough and you get a clear signal if it's there.

If you're really into how exactly p-values are calculated here, read this paper: "Asymptotic formulae for likelihood-based tests of new physics" by Cowan et al

Aksakal
  • 55,939
  • 5
  • 90
  • 176
  • 2
    Everybody was hoping that the 750 GeV peak is real and is now sad. But I was actually hoping it would turn out to be a fluctuation (and could have bet it would) and am now relieved. I think it's cool that standard model works so well. Don't quite understand the burning desire to move *beyond* standard model (as if everything else in physics is solved). Anyway, +1, good example. – amoeba Aug 06 '16 at 23:51
2

The other explanations are all fine, I just wanted to try and give a brief and direct answer to the question that popped into my head.

Checking Covariate Imbalance in Randomized Experiments

Your second claim (about unrealistic null hypotheses) is not true when we are checking covariate balance in randomized experiments where we know the randomization was done properly. In this case, we know that the null hypothesis is true. If we get a significant difference between treatment and control group on some covariate - after controlling for multiple comparisons, of course - then that tells us that we got a "bad draw" in the randomization and we maybe shouldn't trust the causal estimate as much. This is because we might think that our treatment effect estimates from this particular "bad draw" randomization are further away from the true treatment effects than estimates obtained from a "good draw."

I think this is a perfect use of p-values. It uses the definition of p-value: the probability of getting a value as or more extreme given the null hypothesis. If the result is highly unlikely, then we did in fact get a "bad draw."

Balance tables/statistics are also common when using observational data to try and make causal inferences (e.g., matching, natural experiments). Although in these cases balance tables are far from sufficient to justify a "causal" label to the estimates.

  • I disagree that this is a perfect (or even good) use of p-values. How do you define a "bad draw"? – mark999 Mar 12 '16 at 06:28
  • @mark999 A "bad draw" is one in which there is covariate imbalance, even though we know we randomized properly. The reason these draws are bad is because it implies that the causal effect estimate $\hat\tau$ will be further from the true effect $\tau$ than if we had gotten a good draw (because covariates influence the outcome variable). Our goal is to estimate $\tau$ well. –  Mar 12 '16 at 06:33
  • But what precisely do you mean by "covariate imbalance"? – mark999 Mar 12 '16 at 06:36
  • @mark999 the empirical distribution of covariates in the treatment group is not the same as the empirical distribution of covariates in the control group. The reason we randomize is to try to make sure that both observed and unobserved covariates (particularly those that correlate with the outcome) do not vary based on assignment to treatment or control group (which we randomized independently of the covariates). –  Mar 12 '16 at 06:40
  • Considering just a single covariate and assuming equal sample sizes for simplicity, I interpret "the empirical distribution of covariates in the treatment group is not the same as the empirical distribution of covariates in the control group" as meaning that the sample values of the covariate in the control group are not exactly the same as the sample values of the covariate in the treatment group. Is that what you meant? – mark999 Mar 12 '16 at 07:23
  • @mark999 I mean that the distribution of this single covariate $X$ is not the same in the treatment as in the control group (imagine side-by-side density plots). People usually test this with t-tests and KS-tests for each covariate. –  Mar 12 '16 at 07:32
  • I don't think chat is necessary (I apologise if this is bad manners - I'm not familiar with the etiquette for moving a discussion to chat). When you say "the distribution of this single covariate $X$ is not the same...", do you mean the distribution in the population, or do you mean the distribution in the sample? – mark999 Mar 12 '16 at 07:54
  • I disagree. If you get a low *p*-value ‘after controlling for multiple comparisons’, that doesn’t really tell you much, since you *know* the null hypothesis is true. And that you have ‘covariate inbalance’ on a variable, e.g. the people in group *A* are on average older than the ones in group *B*, doesn’t mean that you have a ‘bad draw’. You might very well have a different (perhaps not measured) variable that *counterbalances* this problem, e.g. group *B* have more smokers. And randomisation typically results in the inbalances’ effect on the outcome cancelling out (in large samples). – Karl Ove Hufthammer Mar 12 '16 at 17:12
  • @mark999: The etiquette is that the comments are not for prolonged discussions and in particular not for Socratic questioning. If you have an objection, everybody will be grateful if you state it straight away and as clear as possible. – amoeba Mar 12 '16 at 21:51
  • @amoeba I had to look up the meaning of "Socratic questioning" but I don't think that's what I was doing. All my questions were aimed at clarifying precisely what Matt means by "bad draw", and in my opinion he has still not made that clear. I do have an objection but I don't think it's worth stating until I understand Matt's argument, because the objection will be different depending on what he means. – mark999 Mar 12 '16 at 22:16
  • 2
    @mark, Okay. I think I can reply your last question while Matt is away: of course in the sample. Imagine a randomized experiment with 50 people. Imagine that it just so happened that all 25 people in group A turned out to be men and all 25 people in group B turned out to be women. It's pretty obvious that this can cast serious doubts on any conclusions of the study; that's an example of a "bad draw". Matt suggested to run a test for differences in gender (covariate) between A and B. I don't see how Matt's answer can be interpreted differently. There are arguably no populations here at all. – amoeba Mar 12 '16 at 22:34
  • @amoeba Thanks. But the answer "of course in the sample" implies that any difference in the sample makes a draw "bad", so (13 men, 12 women) in group A and (12 men, 13 women) in group B would be a "bad draw". Clearly that's ridiculous. I agree that your example is an example of a "bad draw", but what is the defintion of "bad draw"? I understand what Matt is suggesting, but not the reasoning behind the suggestion. No problem if you don't want to continue discussing this. – mark999 Mar 12 '16 at 23:12
  • 1
    @mark999 But a test for difference between 12/25 and 13/25 will obviously yield high non-significant p-value, so I am not sure what is your point here. Matt suggested to run a test and consider a low p-value as a red flag. No red flag in your example. I think I will stop here and let Matt continue the dialog if he wants. – amoeba Mar 12 '16 at 23:26
  • @amoeba Thanks. I'll probably stop here too, although I may comment further on your answer. – mark999 Mar 13 '16 at 00:14
  • 4
    No. See 'balance test fallacy': http://gking.harvard.edu/files/matchse.pdf You describe a case where the test statistic itself may be fine (used as a distance measure to minimise) but a p-value for it makes no sense. – conjugateprior Mar 13 '16 at 22:14
  • @conjugateprior Probably a good idea to give a full citation in case the link goes dead: Imai, K., King, G., & Stuart, E. A. (2008). Misunderstandings between experimentalists and observationalists about causal inference. *Journal of the Royal Statistical Society: Series A (Statistics in Society)*, 171(2), 481-502. – Silverfish Apr 07 '16 at 11:39
  • 2
    For a more recent examination of this in psycho- and neurolinguistics, there is a new [arXiv preprint](https://arxiv.org/abs/1602.04565). When you're deliberating manipulating balance, etc., you're not random sampling and even if you were, the tests answer a different inferential question about balance in population not balance in the sample. – Livius Jun 10 '16 at 03:33
2

Error rates control is similar to quality control in production. A robot in a production line has a rule for deciding that a part is defective which guarantees not to exceed a specified rate of defective parts that go through undetected. Similarly, an agency that makes decisions for drug approval based on "honest" P-values has a way to keep the rate of false rejections at a controlled level, by definition via the frequentist long-run construction of tests. Here, "honest" means absence of uncontrolled biases, hidden selections, etc.

However, neither the robot, nor the agency have a personal stake in any particular drug or a part that goes through the assembly conveyor. In science, on the other hand, we, as individual investigators care most about the particular hypothesis we study, rather than about the proportion of spurious claims in our favorite journal we submit to. Neither the P-value magnitude nor the bounds of a confidence interval (CI) refer directly to our question about the credibility of what we report. When we construct the CI bounds, we should be saying that the only meaning of the two numbers is that if other scientists do the same kind of CI computation in their studies, the 95% or whatever coverage will be maintained over various studies as a whole.

In this light, I find it ironic that P-values are being "banned" by journals, considering that in the thick of replicability crisis they are of more value to journal editors than to researchers submitting their papers, as a practical way of keeping the rate of spurious findings reported by a journal at bay, in the long run. P-values are good at filtering, or as IJ Good wrote, they are good for protecting statistician's rear end, but not so much the rear end of the client.

P.S. I'm a huge fan of Benjamini and Hochberg's idea of taking the unconditional expectation across studies with multiple tests. Under the global "null", the "frequentist" FDR is still controlled - studies with one or more rejections pop up in a journal at a controlled rate, although, in this case, any study where some rejections have been actually made has the proportion of false rejections that is equal to one.

D.Z.
  • 21
  • 2
1

I agree with Matt that p-values are useful when the null hypothesis is true.

The simplest example I can think of is testing a random number generator. If the generator is working correctly, you can use any appropriate sample size of realizations and when testing the fit over many samples, the p-values should have a uniform distribution. If they do, this is good evidence for a correct implementation. If they don't, you know you have made an error somewhere.

Other similar situations occur when you know a statistic or random variable should have a certain distribution (again, the most obvious context is simulation). If the p-values are uniform, you have found support for a valid implementation. If not, you know you have a problem somewhere in your code.

soakley
  • 4,341
  • 3
  • 16
  • 27
1

I can think of example in which p-values are useful, in Experimental High Energy Physics. See Fig.1 This plot is taken from this paper: Observation of a new particle in the search for the Standard Model Higgs boson with the ATLAS detector at the LHC

In this Fig, the p-value is shown versus the mass of an hypothetical particle. The null hypothesis denotes the compatibility of the observation with a continuous background. The large ($5 \sigma$) deviation at m$_\mathrm{H} \approx 125$ GeV was the first evidence and discovery of a new particle. This earned François Englert, Peter Higgs the Nobel Prize in Physics in 2013.

enter image description here