3

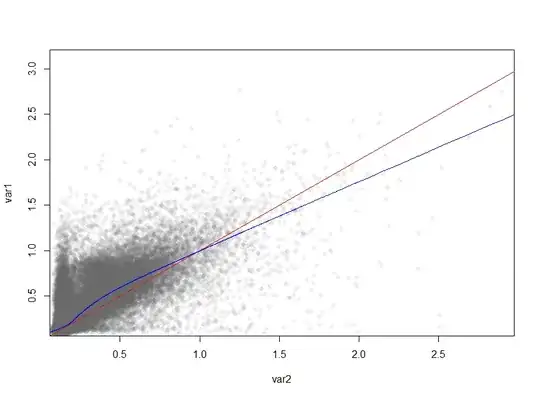
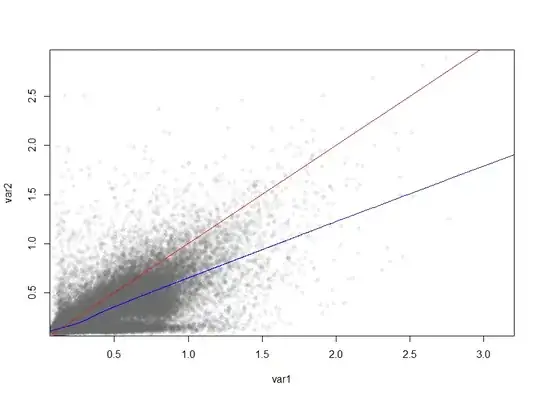
I am generating plots of sd v sd of two groups and using the LOWESS curve to demonstrate whether there is variability in one group over the other. However it appears the my selection of which variable appears on which axis is having a large effect on the LOWESS curve. Why would this be?

plot(var1, var2, col =alpha(rgb(102,102,102,50,maxColorValue=255),0.1),pch=16, bg ='white', xaxs = "i", yaxs="i")
abline(0,1, col='red')
lines(lowess(var1,var2), col="blue")

plot(var2, var1, col =alpha(rgb(102,102,102,50,maxColorValue=255),0.1),pch=16, bg ='white', xaxs = "i", yaxs="i")
abline(0,1, col='red')
lines(lowess(var2,var1), col="blue")

Plot1

Plot2

Is there a reason for this? Is there are better method than the LOWESS curve to use?
George
  • 143
  • 2
  • 6
    Apart from the fact the blue curves are not straight, this is not that different to saying OLS regression produces a different relationship when regressing $x$ against $y$ rather than $y$ against $x$ (with the difference being bigger when the correlation is lower) – Henry Apr 04 '17 at 23:37

1 Answers1

2

This is really answered by the answers to the same question for linear regression. It isn't as readily answered for lowess (since there is no closed formula for lowess), but the root cause is the same: Regressing y on x, and regressing x on y answers two different questions, it optimizes two different cost functions. The same line/curve is simply not optimum in both cases.

kjetil b halvorsen
  • 63,378
  • 26
  • 142
  • 467
  • 3
    +1. But I would contend that this question *is* "readily answered for lowess," because lowess repeatedly applies linear regression of y against x (in a weighted moving window using a robust loss function, but none of those details affects the basic conclusion that reversing x and y changes the model and *ought* to change the results). – whuber Oct 07 '18 at 12:30