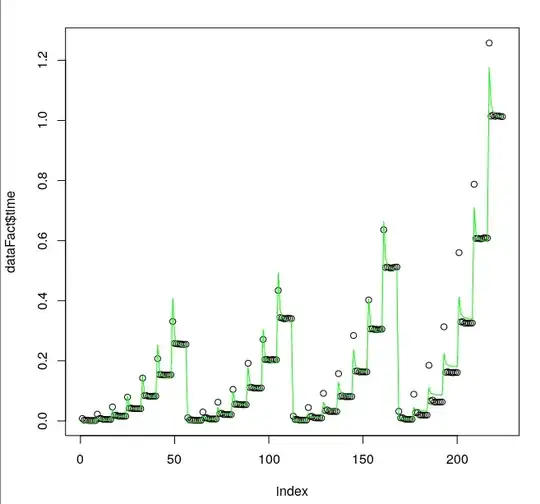
I'm trying to fit some data with linear regression like this:
Call:
lm(formula = time ~ nDOF:ndoms + I(nDOF^2):ndoms + I(1/nprocs^2):nDOF,
    data = dataFact)

Residuals:
      Min        1Q    Median        3Q       Max
-0.077190 -0.007059  0.000202  0.006533  0.148240

Coefficients:
                     Estimate Std. Error t value Pr(>|t|)
(Intercept)        -9.807e-03  2.123e-03  -4.619 6.57e-06 ***
nDOF:ndoms          3.441e-08  1.231e-09  27.963  < 2e-16 ***
ndoms:I(nDOF^2)     1.749e-12  8.741e-14  20.014  < 2e-16 ***
nDOF:I(1/nprocs^2)  1.103e-05  5.630e-07  19.586  < 2e-16 ***
---
Signif. codes:  0 ‘***’ 0.001 ‘**’ 0.01 ‘*’ 0.05 ‘.’ 0.1 ‘ ’ 1

Residual standard error: 0.02039 on 220 degrees of freedom
Multiple R-squared:  0.9926,    Adjusted R-squared:  0.9925
F-statistic:  9857 on 3 and 220 DF,  p-value: < 2.2e-16
As we can see, the fit is pretty good, but unfortunately, the smallest predicted values tend to be negative.

Is there any way I could "shift" my model a little?
My attempt
I tried to solve the situation using generalized linear regression, like this
Call:
glm(formula = time ~ nDOF:ndoms + I(nDOF^2):ndoms + I(1/nprocs^2):nDOF,
    family = gaussian(link = "log"), data = dataFact)

Deviance Residuals:
     Min        1Q    Median        3Q       Max
-0.19161  -0.07415  -0.04443   0.01376   0.23374

Coefficients:
                     Estimate Std. Error t value Pr(>|t|)
(Intercept)        -2.550e+00  6.269e-02 -40.682  < 2e-16 ***
nDOF:ndoms          2.248e-07  1.582e-08  14.212  < 2e-16 ***
ndoms:I(nDOF^2)    -5.015e-12  9.254e-13  -5.420 1.57e-07 ***
nDOF:I(1/nprocs^2)  2.435e-05  3.958e-06   6.152 3.58e-09 ***
---
Signif. codes:  0 ‘***’ 0.001 ‘**’ 0.01 ‘*’ 0.05 ‘.’ 0.1 ‘ ’ 1

(Dispersion parameter for gaussian family taken to be 0.006711178)

    Null deviance: 12.3909  on 223  degrees of freedom
Residual deviance:  1.4764  on 220  degrees of freedom
AIC: -479.25
But as we can see, the plot is completely out
What am I doing wrong here? And is there any easy way to maintain the shape of the curve and just use GLM to predict only positive numbers?
My data
nprocs,nthreads,ndoms,size,nDOF,time
1,24,288,4,375,0.0946295
2,12,288,4,375,0.0641595
3,8,288,4,375,0.0599065
4,6,288,4,375,0.0549505
6,4,288,4,375,0.0538465
8,3,288,4,375,0.05184975
12,2,288,4,375,0.051091
24,1,288,4,375,0.0534245
1,24,288,6,1029,0.301089
2,12,288,6,1029,0.205296
3,8,288,6,1029,0.1908795
4,6,288,6,1029,0.1785225
6,4,288,6,1029,0.170867
8,3,288,6,1029,0.16909225
12,2,288,6,1029,0.169228
24,1,288,6,1029,0.1673835
1,24,288,8,2187,0.68576575
2,12,288,8,2187,0.49339725
3,8,288,8,2187,0.44999925
4,6,288,8,2187,0.4184415
6,4,288,8,2187,0.4006765
8,3,288,8,2187,0.39963125
12,2,288,8,2187,0.394082
24,1,288,8,2187,0.3925375
1,24,288,10,3993,1.32663875
2,12,288,10,3993,0.94414525
3,8,288,10,3993,0.87997
4,6,288,10,3993,0.816276
6,4,288,10,3993,0.78842875
8,3,288,10,3993,0.77410125
12,2,288,10,3993,0.7764705
24,1,288,10,3993,0.7638315
1,24,288,12,6591,2.2723285
2,12,288,12,6591,1.64944125
3,8,288,12,6591,1.52428725
4,6,288,12,6591,1.40552625
6,4,288,12,6591,1.3529915
8,3,288,12,6591,1.334635
12,2,288,12,6591,1.325433
24,1,288,12,6591,1.323585
1,24,288,14,10125,3.573002
2,12,288,14,10125,2.588366
3,8,288,14,10125,2.42213025
4,6,288,14,10125,2.23624525
6,4,288,14,10125,2.14378325
8,3,288,14,10125,2.1225845
12,2,288,14,10125,2.11212025
24,1,288,14,10125,2.1014935
1,24,288,16,14739,5.3447225
2,12,288,16,14739,3.8467885
3,8,288,16,14739,3.627996
4,6,288,16,14739,3.3243295
6,4,288,16,14739,3.2092895
8,3,288,16,14739,3.16907825
12,2,288,16,14739,3.1560615
24,1,288,16,14739,3.12689
1,24,384,4,375,0.115369
2,12,384,4,375,0.0803815
3,8,384,4,375,0.0763355
4,6,384,4,375,0.07056225
6,4,384,4,375,0.0682565
8,3,384,4,375,0.07106375
12,2,384,4,375,0.06758
24,1,384,4,375,0.07009675
1,24,384,6,1029,0.3517015
2,12,384,6,1029,0.26008075
3,8,384,6,1029,0.2434895
4,6,384,6,1029,0.229354
6,4,384,6,1029,0.222431
8,3,384,6,1029,0.22455025
12,2,384,6,1029,0.22294525
24,1,384,6,1029,0.21949025
1,24,384,8,2187,0.814259
2,12,384,8,2187,0.6097535
3,8,384,8,2187,0.579098
4,6,384,8,2187,0.54244075
6,4,384,8,2187,0.5272745
8,3,384,8,2187,0.532494
12,2,384,8,2187,0.52172925
24,1,384,8,2187,0.52157525
1,24,384,10,3993,1.5572355
2,12,384,10,3993,1.197648
3,8,384,10,3993,1.1347285
4,6,384,10,3993,1.056746
6,4,384,10,3993,1.02914675
8,3,384,10,3993,1.01935525
12,2,384,10,3993,1.02304
24,1,384,10,3993,1.01973325
1,24,384,12,6591,2.6899245
2,12,384,12,6591,2.06899875
3,8,384,12,6591,1.95328225
4,6,384,12,6591,1.83718875
6,4,384,12,6591,1.79995825
8,3,384,12,6591,1.7651285
12,2,384,12,6591,1.7616405
24,1,384,12,6591,1.7832275
1,24,384,14,10125,4.24194525
2,12,384,14,10125,3.25947975
3,8,384,14,10125,3.102823
4,6,384,14,10125,2.910768
6,4,384,14,10125,2.84159925
8,3,384,14,10125,2.812863
12,2,384,14,10125,2.79452
24,1,384,14,10125,2.783541
1,24,384,16,14739,6.34359525
2,12,384,16,14739,4.87417475
3,8,384,16,14739,4.68763775
4,6,384,16,14739,4.409049
6,4,384,16,14739,4.225499
8,3,384,16,14739,4.19000525
12,2,384,16,14739,4.1685855
24,1,384,16,14739,4.13447625
1,24,576,4,375,0.149258
2,12,576,4,375,0.11306475
3,8,576,4,375,0.1106305
4,6,576,4,375,0.10277875
6,4,576,4,375,0.10034075
8,3,576,4,375,0.09992475
12,2,576,4,375,0.100055
24,1,576,4,375,0.1013415
1,24,576,6,1029,0.4631635
2,12,576,6,1029,0.363534
3,8,576,6,1029,0.346867
4,6,576,6,1029,0.33634225
6,4,576,6,1029,0.327822
8,3,576,6,1029,0.32915075
12,2,576,6,1029,0.325756
24,1,576,6,1029,0.3244965
1,24,576,8,2187,1.0745575
2,12,576,8,2187,0.8715855
3,8,576,8,2187,0.8237175
4,6,576,8,2187,0.7936485
6,4,576,8,2187,0.78037075
8,3,576,8,2187,0.78318125
12,2,576,8,2187,0.7757685
24,1,576,8,2187,0.769712
1,24,576,10,3993,2.0662435
2,12,576,10,3993,1.69664675
3,8,576,10,3993,1.61632025
4,6,576,10,3993,1.55593225
6,4,576,10,3993,1.52227825
8,3,576,10,3993,1.52255425
12,2,576,10,3993,1.51433725
24,1,576,10,3993,1.5073515
1,24,576,12,6591,3.55465175
2,12,576,12,6591,2.9219815
3,8,576,12,6591,2.813871
4,6,576,12,6591,2.688473
6,4,576,12,6591,2.642868
8,3,576,12,6591,2.62695125
12,2,576,12,6591,2.62418275
24,1,576,12,6591,2.63111275
1,24,576,14,10125,5.62003375
2,12,576,14,10125,4.66024075
3,8,576,14,10125,4.45642925
4,6,576,14,10125,4.269482
6,4,576,14,10125,4.20735775
8,3,576,14,10125,4.180191
12,2,576,14,10125,4.1697685
24,1,576,14,10125,4.17519025
1,24,576,16,14739,8.412904
2,12,576,16,14739,6.920983
3,8,576,16,14739,6.62266525
4,6,576,16,14739,6.36904225
6,4,576,16,14739,6.2505475
8,3,576,16,14739,6.21563775
12,2,576,16,14739,6.198577
24,1,576,16,14739,6.17604925
1,24,1152,4,375,0.26259325
2,12,1152,4,375,0.21321625
3,8,1152,4,375,0.20502075
4,6,1152,4,375,0.19962325
6,4,1152,4,375,0.1968235
8,3,1152,4,375,0.19961675
12,2,1152,4,375,0.20011775
24,1,1152,4,375,0.19877925
1,24,1152,6,1029,0.79873425
2,12,1152,6,1029,0.69796225
3,8,1152,6,1029,0.67075925
4,6,1152,6,1029,0.6483425
6,4,1152,6,1029,0.648511
8,3,1152,6,1029,0.64445625
12,2,1152,6,1029,0.6470985
24,1,1152,6,1029,0.63747875
1,24,1152,8,2187,1.84742675
2,12,1152,8,2187,1.624627
3,8,1152,8,2187,1.5797865
4,6,1152,8,2187,1.5516275
6,4,1152,8,2187,1.53921525
8,3,1152,8,2187,1.53861475
12,2,1152,8,2187,1.5321545
24,1,1152,8,2187,1.520184
1,24,1152,10,3993,3.5739245
2,12,1152,10,3993,3.15653825
3,8,1152,10,3993,3.120543
4,6,1152,10,3993,3.0330285
6,4,1152,10,3993,3.0156615
8,3,1152,10,3993,3.00419675
12,2,1152,10,3993,2.995779
24,1,1152,10,3993,2.9914245
1,24,1152,12,6591,6.14267725
2,12,1152,12,6591,5.5148995
3,8,1152,12,6591,5.35443675
4,6,1152,12,6591,5.25097775
6,4,1152,12,6591,5.26166925
8,3,1152,12,6591,5.1859525
12,2,1152,12,6591,5.21059225
24,1,1152,12,6591,5.17157525
1,24,1152,14,10125,9.910901
2,12,1152,14,10125,8.696456
3,8,1152,14,10125,8.519928
4,6,1152,14,10125,8.34710125
6,4,1152,14,10125,8.30145125
8,3,1152,14,10125,8.23857
12,2,1152,14,10125,8.28954975
24,1,1152,14,10125,8.22843225
1,24,1152,16,14739,14.4608565
2,12,1152,16,14739,12.976403
3,8,1152,16,14739,12.6674635
4,6,1152,16,14739,12.430683
6,4,1152,16,14739,12.319599
8,3,1152,16,14739,12.27644125
12,2,1152,16,14739,12.2994265
24,1,1152,16,14739,12.2351635
