I have some data with missing values. For the missing observations I know a range, in which the true values are. I want to use a tobit model to predict the variable with these missing values. The missing values should then be replaced/imputed by the predictions. Here is some example data:
N <- 1000
x1 <- rnorm(N, 5000, 10000)
x2 <- x1 + rnorm(N, 0, 5000)
x3 <- x2 + rnorm(N, 1000, 3000)

# Range == 1: lower 1000
# Range == 2: >= 1000 & <= 3000
# Range == 3: > 3000
range <- rbinom(N, 1, 0.1)
x1[range == 1] <- NA
range[range == 1] <- sample(1:3, sum(range), replace = TRUE)

data <- data.frame(x1, x2, x3, range)
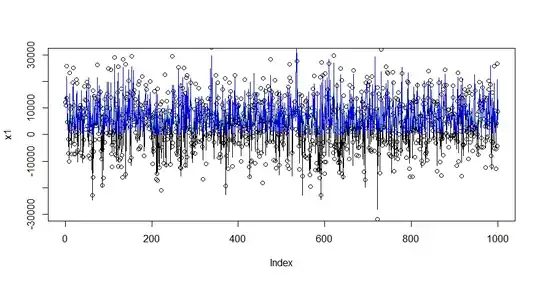
In another thread on stackexchange, I already found an example, in which predictions for data cencored below 0 are calculated (see the answer of Achim Zeileis): Censored regression in R. With his code, I can predict values above 0:
library("AER")

fit <- tobit(x1 ~ ., left = 0, data = data)

mu <- fitted(fit)
sigma <- fit$scale
p0 <- pnorm(mu/sigma)
lambda <- function(x) dnorm(x)/pnorm(x)
ey0 <- mu + sigma * lambda(mu/sigma)
ey <- p0 * ey0
min(ey) # Works fine

# Visualization
plot(x1, ylim = c(- 30000, 30000))
lines(mu, col = "slategray")
lines(predict(fit), col = "black")
lines(ey0, col = "green")
lines(ey, col = "blue")
However, I am struggling with the prediction of my missing values, since I can not figure out how to respect several ranges at the same time. Is there a way, how I could predict values according to these ranges?
UPDATE:
After some further research, I have recognized that a survival analysis via the survival package might be able to do what I am looking for (see chapter 4.2: http://www.ms.uky.edu/~mai/Rsurv.pdf). Here is what I have done so far (reproducible example):
library("survival")

N <- 1000 # I modified the data and ranges a bit, to get stronger predictions
x1 <- rnorm(N, 4000, 1500)
x2 <- x1 + rnorm(N, 0, 5000)
x3 <- x1 + rnorm(N, 1000, 3000)

# Range == 1: lower 1000
# Range == 2: >= 1000 & < 3000
# Range == 3: >= 3000 & < 5000
# Range == 4: >= 5000 & < 8000
# Range == 5: >= 8000

dummy <- rbinom(N, 1, 0.2)
range_up <- x1
range_up[dummy == 1 & x1 < 1000] <- 999
range_up[dummy == 1 & x1 >= 1000 & x1 < 3000] <- 2999
range_up[dummy == 1 & x1 >= 3000 & x1 < 5000] <- 4999
range_up[dummy == 1 & x1 >= 5000 & x1 < 8000] <- 7999
range_up[dummy == 1 & x1 >= 8000] <- 999999

range_low <- range_up
range_low[range_up == 999] <- - 999999
range_low[range_up == 2999] <- 1000
range_low[range_up == 4999] <- 3000
range_low[range_up == 7999] <- 5000
range_low[range_up == 999999] <- 8000

data <- data.frame(x1, x2, x3)

# Survival analysis
mod <- survreg(Surv(time = range_low, time2 = range_up, type = "interval2") ~ .,
           data = data[colnames(data) %in% "x1" == FALSE],
           dist = "gaussian")
sum_mod <- summary(mod)

# Sigma (UPDATE 2)
sigma <- sum_mod$scale

# Predictions
range_predict <- as.numeric(predict(mod, data))

# Function for the imputation - a random residual gets added - imputed value must be within the predefined range
fun_range_sa <- function(data_ranges, range_low, range_upp){

  if(length(data_ranges[range_up == range_upp, ]$x1) > 0) {

# Boundaries
a <- (range_low - range_predict) / sigma
b <- (range_upp - range_predict) / sigma

# Output - residuals are chosen, so that the final output is within the given ranges
(sigma * (qnorm(pnorm(a) + runif(length(range_predict)) * (pnorm(b) - pnorm(a)))) +
    range_predict)[range_up == range_upp]

  }
}

# Imputation
data[range_up == 999, ]$x1 <- fun_range_sa(data_ranges = data, range_low = - 999999, range_upp = 999)
data[range_up == 2999, ]$x1 <- fun_range_sa(data_ranges = data, range_low = 1000, range_upp = 2999)
data[range_up == 4999, ]$x1 <- fun_range_sa(data_ranges = data, range_low = 3000, range_upp = 4999)
data[range_up == 7999, ]$x1 <- fun_range_sa(data_ranges = data, range_low = 5000, range_upp = 7999)
data[range_up == 999999, ]$x1 <- fun_range_sa(data_ranges = data, range_low = 8000, range_upp = 999999)

# Visualization
plot(x1, data$x1)
Like you can see, I managed to find a solution for my problem. The imputed values are based on predictions of a model and the imputed values are always within the predefined range. However, I am quite new to survival analysis. Further recommendations for improvements or a confirmation of my code are therefore very appreciated!
