2

enter image description here

I am currently doing a thesis on the impacts of oil prices on the macroeconomy. The literature suggests that there is a negative relationship between the oil price and the GDP. After running a basic regression, my results contradict this theory:

With GDP as my dependent variable, the coefficients of the independent variables are as followed:

Oil                  0.005558  
CPI                 -0.216906  
Balance of payments  0.068550  
Money Supply        -0.141428  
Federal Funds Rate   0.065686

I don't know why this is. Using Eviews I have induced stationarity for all variables and the coefficients are all significant. Any help/suggestions would be greatly appreciated!

My results are below.

enter image description here

Richard Hardy
  • 54,375
  • 10
  • 95
  • 219
Stewart22
  • 21
  • 4
  • 0.005558 seems really small, as well as your other coefficients. I cannot see the image as I am through a secured network at work, but what is the scale of your data? – Jon Feb 16 '17 at 23:59
  • 1
    This should be moved to economics. – Dave Harris Feb 17 '17 at 00:03
  • Can you include a plot of your data? Are you sure a linear fit for each variable is appropriate? – Matthew Drury Feb 17 '17 at 00:12
  • 3
    Sorry to sound snarky, but in the cities in the US that have raised the minimum wage, there is at least some evidence that this hasn't led to the level of job losses that economic theory would predict. Economic theory should never be viewed as ironclad. It makes a lot of simplifying assumptions. Your results could contradict theory for any number of reasons. Markets can be a lot less efficient than we think. Your variables might be measured imprecisely, or they might be measured in a biased fashion. your data are observational, and all else is not equal. – Weiwen Ng Feb 17 '17 at 02:59
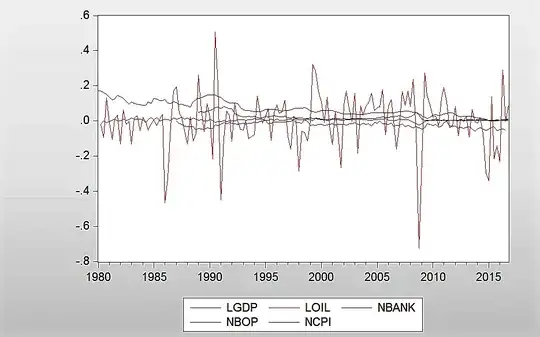
  • @Jon,Regarding the scale i'm not 100% clear on what you mean, but here's my interpretation. For the variables NBOP, NCPI, NRATE, NM4, they have all been divided by 100 as they were in absolute values (2%) instead of decimal places (0.02). I have differenced the log of oil price and GDP - which gives me the growth rate of both in decimal places. MatthewDrury, I have added the plot of my data. Do you think a linear fit is still best? WeiwenNG - you make fair points - thanks – Stewart22 Feb 17 '17 at 10:17
  • 1
    You need to give more information on your data! The data points concerne countries? Which countries? There might well be differences between rich and poor countries, oil-producers and consumers, for instance. Time series? How many years? ... – kjetil b halvorsen Feb 17 '17 at 10:26
  • @kjetilbhalvorsen The time period is given on my results above - 1989Q1 - 2016Q3. The data is for UK, who became a net oil-importer in 2006, which may have implications for my results. That said, the coefficient for Money Supply is really contradictory. – Stewart22 Feb 17 '17 at 10:59
  • Maybe you should investigate if there is a structural break around 2006 then? And, why do economic theory predict a negative dependence on GDP from oil price? Oil is't in any way similar to other products, high oil price might very well be an indicator of high economic activity ... – kjetil b halvorsen Feb 17 '17 at 11:13

3 Answers3

3

Endogeneity
The macroeconomic variables you are studying are likely to affect each other. In particular, the variables on the right hand side of your model might be affected by the variable on the left hand side. That is known as the problem of endogeneity, which results in inconsistent estimates of model parameters and problems in interpreting the model.
A possible remedy to the problem is to use a (structural) VAR or (structural) VEC model that are estimated in reduced form that ensures endogeneity is not a problem. (I will not expand on how that works, but you will find plenty of material online.)

Unit roots
Are you using logged time series but not log-returns? Quite a few of the series are likely to be integrated (e.g. GPD and oil price, probably also others), which would result in nonstandard distribution of the coefficient estimates and/or the left-hand-side variable diverging from any linear combination of the right-hand-side variables.
To deal with that, you could investigate presence of cointegration and then either (in case of cointegration) proceed to VEC modelling or (in absence of cointegration) to VAR modelling on first-differenced data.

Autocorrelated errors
Another (smaller) problem might be autocorrelation in your model errors, which would lead to imprecise estimation of standard errors and statistical significance. Based on the model setup, I would guess there will be autocorrelation in the errors, and hence the problems.
That could be avoided by going for VAR or VEC model as mentioned above.

(I suppose, besides the VAR and VEC models there could be other solutions, too.
Also, there may be other problems with the model, while I am listing just the few obvious ones.)
Richard Hardy
  • 54,375
  • 10
  • 95
  • 219
  • Thanks for your suggestions. I initially thought about using the VECM, however I was unsure about whether it's suitable. If i'm correct - you can only use VECM if you have I(1) variables? In my model, only GDP and Oil are I(1), the rest follow I(0). So does that mean that it's not possible to use VECM? – Stewart22 Feb 21 '17 at 23:04
  • @Stewart22, I give an example how to do precisely that in [this thread](http://stats.stackexchange.com/questions/148994/var-or-vecm-for-a-mix-of-stationary-and-nonstationary-variables). – Richard Hardy Feb 22 '17 at 06:12
0

Another slant: OLS regression techniques were developed to summarize cross-sectional data. Your data is time series, which requires the application of time series techniques. You might try using transfer functions (dynamic regressions) for a single equation model. Mr. Hardy's responses below are directly on target, particularly his last.

0

Countries that export oil probably respond differently than countries that don't. You could try to control for that.