I am trying to correctly interpret and plot the effects of a multinomial model fit in R. The data and script are here for reproducing the problem.
The multinomial variable describes different outcomes of a videogame where players have to hit a moving target. 3 is a miss, 2 is a non critical hit and 1 is a critical hit. The predictors are traits like the speed of the target, its body size (svl) or relative tail size, its behavior in the videogame (strategy) and the contrast of the tail color with the background (tailcontrst).
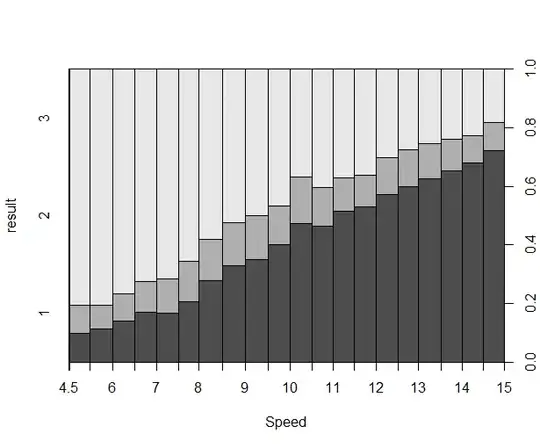
I strongly expect that speed makes it more difficult to give critical hits, however, the odds of higher values decrease with speed, as the table and the graph shows.
polr(formula = result ~ 1 + Speed + svl + svl:Speed + tailcontrst:Reltailsize +
strategy:svl, data = results)

Coefficients:
                        Value Std. Error t value
Speed                   -0.266959  0.0079756 -33.472
svl                      0.075696  0.0016456  45.999

Speed:svl               -0.001898  0.0001965  -9.658
tailcontrst:Reltailsize  0.000405  0.0001375   2.946
svl:strategy            -0.009896  0.0007036 -14.064