As you know the Brier score measures calibration and is the mean square error, $\bar B = n^{-1} \sum (\hat y_i - y_i)^2$, between the predictions, $\hat y,$ and the responses, $y$. Since the Brier score is a mean, comparing two Brier scores is basically a comparison of means and you can go as fancy with it as you like. I'll suggest two things and point to a third:
One option: do a t-test
My immediate response when I hear comparisons of means is to do a t-test. Squared errors probably aren't normally distributed in general so it's possible that this isn't the most powerful test. It seems fine in your extreme example. Below I test the alternative hypothesis that p1 has greater MSE than p2:
y <- rbinom(100,1,1:100/100)
p1 <- 1:100/10001
p2 <- 1:100/101

squares_1 <- (p1 - y)^2
squares_2 <- (p2 - y)^2

t.test(squares_1, squares_2, paired=T, alternative="greater")
#>
#>  Paired t-test
#>
#> data:  squares_1 and squares_2
#> t = 4.8826, df = 99, p-value = 2.01e-06
#> alternative hypothesis: true difference in means is greater than 0
#> 95 percent confidence interval:
#>  0.1769769       Inf
#> sample estimates:
#> mean of the differences
#>               0.2681719
We get a super-low p-value. I did a paired t-test as, observation for observation, the two sets of predictions compare against the same outcome.
Another option: permutation testing
If the distribution of the squared errors worries you, perhaps you don't want to make assumptions of a t-test. You could for instance test the same hypothesis with a permutation test:
library(plyr)

observed <- mean(squares_1) - mean(squares_2)
permutations <- raply(500000, {
  swap <- sample(c(T, F), 100, replace=T)
  one <- squares_1
  one[swap] <- squares_2[swap]

  two <- squares_2
  two[swap] <- squares_1[swap]

  mean(one) - mean(two)
})

hist(permutations, prob=T, nclass=60, xlim=c(-.4, .4))
abline(v=observed, col="red")
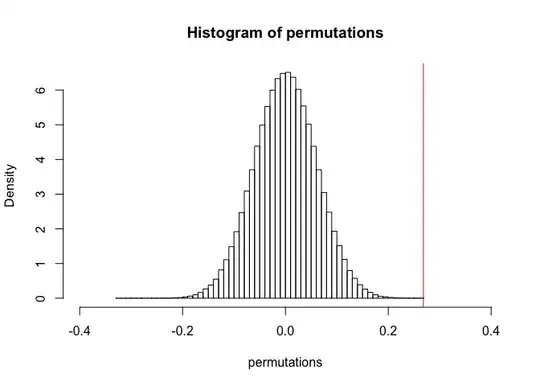
# p-value. I add 1 so that the p-value doesn't come out 0
(sum(permutations > observed) + 1)/(length(permutations) + 1)
#> [1] 1.999996e-06
The two tests seem to agree closely.
Some other answers
A quick search of this site on comparison of MSEs point to the Diebold-Mariano test (see the answer here, and a comment here). This looks like it's simply Wald's test and I guess it will perform similarly to the t-test above.