There is the fitdistr function in the MASS package or some of the functions in the fitdistrplus package. Here are some examples from the latter.
require(fitdistrplus)

set.seed(1)
dat <- rnorm(50,0,1)
f1 <- fitdist(dat,"norm")
f2 <- fitdist(dat,"logis")
f3 <- fitdist(dat,"cauchy")
so for example
> f1
Fitting of the distribution ' norm ' by maximum likelihood
Parameters:
      estimate Std. Error
mean 0.1004483 0.11639515
sd   0.8230380 0.08230325
and you can see the plots with
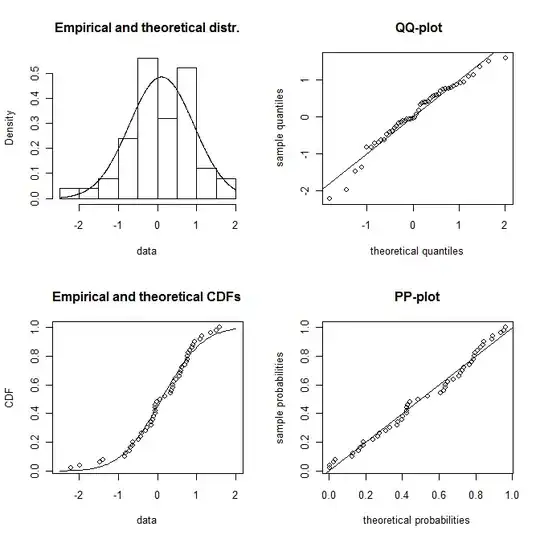
plotdist(dat,"norm",para=list(mean=f1$estimate[1],sd=f1$estimate[2]))
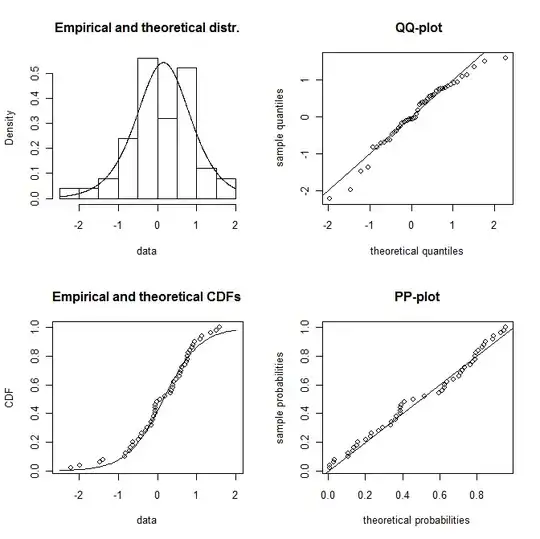
plotdist(dat,"logis",para=list(location=f2$estimate[1],scale=f2$estimate[2]))
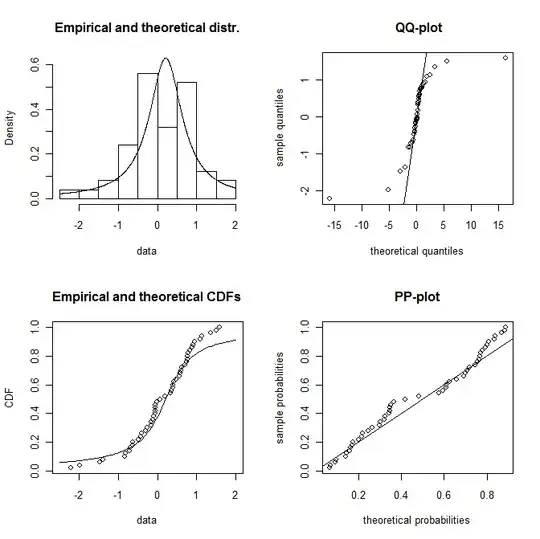
plotdist(dat,"cauchy",para=list(location=f3$estimate[1],scale=f3$estimate[2]))
so it looks plausible as a normal distribution
but also perhaps as a logistic distribution (you will need a larger sample to distinguish them in the tails)
though with a qqplot and looking at the CDF you can tell that this is probably not a Cauchy distribution