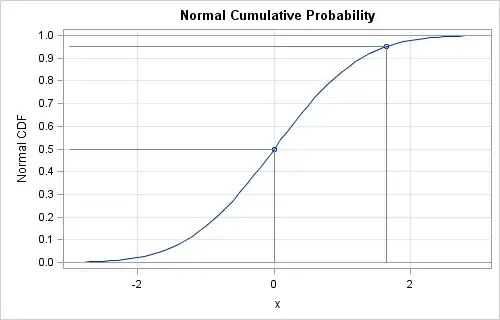
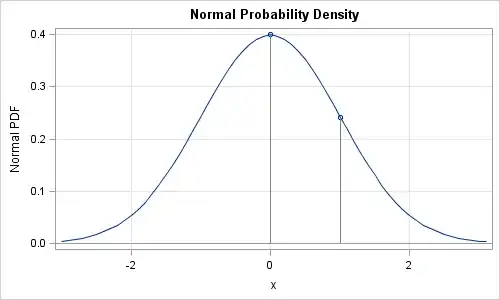
If for a discrete distribution we can say that its PDF answers a question of something like "How possible is exactly this value?", then what would a be similar "human" interpretation of a PDF for a continuous distribution?
And in R, how in some kind of "practical" terms can an illiterate like me interpret something like dnorm(0.2, 0, 1)? What exactly is '0.2'?
Besides, if dnorm reports a probability for a value in an interval, then is it in any way related to pnorm, which kinda also reports probability for a value in an interval (probability for a value in an upper or in a lower tails)? Can dnorm be expressed via two pnorms? Like, Probability(x1 < X < x2) = F(x2) - F(x1) or something like that?

