4

Thank you for you guys effort on building such a nice community and I learned lot by reading and asking.

Background about my logistic regression:

  1. Target Variable: Binary target about volatility of market. "1" for trading days with top 15% percentile volatility day which indicates the extreme day on market. "0" for rest of normal and kind of calm day for market.

  2. Predictor Variable: frequency of 160 trading related key words from famous trading online forum. For example, the word “trader” in 2008-01-01 we found it occurred for 50 times and we found in 2008-01-01 we have totally 500 posts on that forum. Therefore, we kind of normalize the appearance of "trader" by dividing 50 of "trader" by 500 of "number of posts". We got 0.1 here for 2008-01-01. We have 160 words dictionary and the training data is from 2008-01-01 to 2011-12-31. Each row has 160 column with number indicating the frequency of specific words. That is all. Nothing variable of price, volatility here. Kind of pure sentiment data based on frequency counting.

  3. The Goal of Modelling: I think it is quite obvious that we would want to see whether we could have the sentiment words to be good predictor on whether tomorrow would be a EXTRAME VOLATILE DAY?

  4. Software I use: SAS Enterprese Miner 3 in SAS 9.1.3. Here is definition and details of modeling:
    A. I select logistic regression
    B. No data partition because I only have 1000days as my training data so I select to use complete data which means no sampling process and only training data.
    C. I select the backward as we want to see what are those significant predictor out of 160, here is some shortage if using forward.
    D. There is no validation data set so I chose the Crossvalidation-error as my ultimate criteria. Significant level for variable to stay is 0.05.

  5. Result: thankful for the sas easy usage, I got the following graph directly from the the result and modeling manager:

First one is the result: as it shows how many variable left:

http://i.stack.imgur.com/jGCsT.jpg

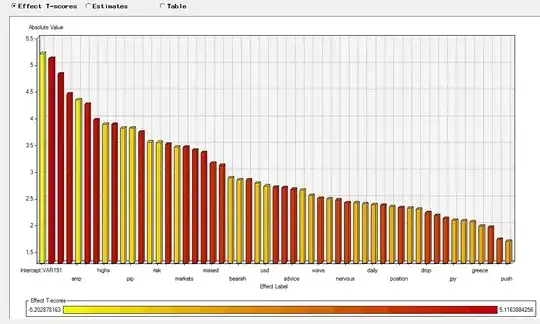
wow, so many variables... scaring.

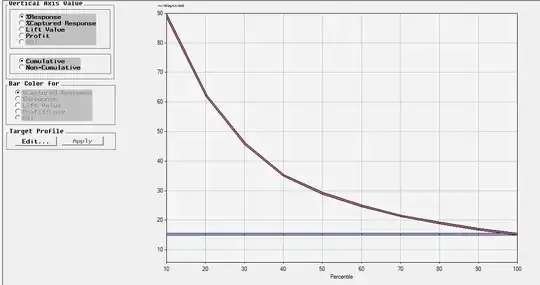
Second one about the response chart which indicates how much we improve the prediction compared to pure random pick or guessing about tomorrow, here, in my case, is about 15% chance you guess it right about whether tomorrow is a volatile day. Response chart looks nice and smooth, right?

http://i.stack.imgur.com/XoCes.jpg

WORRIING:

TOO MANY VARIABLE LEFT HERE. KIND OF SCARING. HOW DO I IMPROVE MODELLING AND INTERPRET THE RESULT?

gung - Reinstate Monica
  • 132,789
  • 81
  • 357
  • 650
Wenhao.SHE
  • 183
  • 7

2 Answers2

10

First of all, thank you for providing context.

Next: Why dichotomize volatility? This makes little sense to me. By doing this, you are saying that the most volatile day was just like the day that was the 149th most volatile (of 1000) and the 151st was just like the 1000th (presumably a day with just about 0 volatility). Dichotomizing increases both type I and type II error, and makes the result less meaningful. Use volatility as a continuous variable instead

Then, don't use backward elimination. The p-values will be too small, the coefficients will be biased away from 0, the model will be too complex. In SAS, you can use GLMSELECT to implement LASSO or LAR. For more on this, see my paper Stopping Stepwise (written with David Cassell). It's here

Even more important, though, unless the stock market acts very differently from the way I think it acts, you will violate the assumption that the residuals are independent. That is, the volatility today depends in part on the volatility yesterday. You need to account for this. There are two broad ways of doing this: Time series analysis and multi-level modeling. I think the latter is probably more suitable here, with the goal of modeling a bunch of independent variables. In SAS, if you take my above advice and don't dichotomize, you can look at PROC MIXED. If you decide to ignore that advice, look at PROC GLIMMIX.

Peter Flom
  • 94,055
  • 35
  • 143
  • 276
  • 1
    Thank you very much at first. I will go to try the proc mixed and report to you. may i contact you by email as well? my email; shewenhao@gmail.com – Wenhao.SHE Mar 16 '12 at 15:33
  • sure. my e-mail is on my website which is on my profile – Peter Flom Mar 16 '12 at 17:40
  • +1. But how would you use a multi-level model to account for the correlated residuals? – Peter Ellis Mar 16 '12 at 18:21
  • http://stats.stackexchange.com/questions/24942/22-word-frequency-variable-has-been-selected-for-predicting-whether-tomorrow-is @PeterFlom , I wrote another question and well come to review that one as well. Thanks lot in advance! – Wenhao.SHE Mar 20 '12 at 16:28
  • http://stats.stackexchange.com/questions/24942/22-word-frequency-variable-has-been-selected-for-predicting-whether-tomorrow-is @PeterEllis , I wrote another question and well come to review that one as well. Thanks lot in advance! – Wenhao.SHE Mar 20 '12 at 16:29
  • @PeterEllis Isn't that one of the main points of multi-level models? Here, there is nesting in time (which always struck me as odd language, but it's used everywhere). AFAIK, the two main uses for multi-level models are nesting in space (e.g. many children in one classroom) or time (as here). – Peter Flom Mar 20 '12 at 17:21
  • Dear Mr. @PeterFlom, did you check my new question:)? Kind of frustrated to understand the glmmix and still use the backward variable selection in my in question. May you add some comments again. Thank you so much!! – Wenhao.SHE Mar 20 '12 at 22:57
  • 1
    OK, thanks @PeterFlom. I can see how you use a mixed effects model in longitudinal panel data to create a group effect for each case with multiple observations, and maybe even each time point with multiple cases but it seems to me that if the issue is that volatility in $t-1$ impacts on volatility in $t$ nesting or grouping won't help and you do need time series methods (perhaps in conjunction with a mixed effects model). – Peter Ellis Mar 21 '12 at 04:27
  • @PeterFlom I found this from sas about glmmix """""The GLIMMIX procedure fits statistical models to data with correlations or nonconstant variability and where the response is not necessarily normally distributed. These models are known as generalized linear mixed models (GLMM)""""""""""" I guess you mean if I do not dischotomize the volatility, I should use GLMMIX, right? Because volatility certaily do not follow normal distribution. And Mixed requires following"The primary assumptions underlying the analyses performed by PROC MIXED are as follows: The data are normally distributed" Thanks – Wenhao.SHE Mar 22 '12 at 21:52
  • Just last thing to remind you. You suggest mixed model for volatility. But the mixed requires normal distribution of the response data. The volatility certainly has heavy tails and is not proper candidate for this mixed model. Just my opinion. Thanks again. – Wenhao.SHE Mar 27 '12 at 17:20
  • There are all sorts of mixed models for all sorts of data. None require that the data be normally distributed, some require that the *residuals* be normally distributed, but some do not. – Peter Flom Mar 27 '12 at 17:40
  • May you give a link you prefer to be a good introduction about mixed model? Because I checked the proc mix provided by the sas and found the requirement is that the target variable is to be normal distribution (http://support.sas.com/documentation/cdl/en/statug/63033/HTML/default/viewer.htm#statug_mixed_sect001.htm) As you know, the volatility is autocorrelated which is ok with mixed model But volatility is certainly not normally distributed. May you share a modified mixed model? Thanks – Wenhao.SHE Mar 28 '12 at 21:48
  • Take a look at the documentation for GLIMMIX and NLMIXED. – Peter Flom Mar 28 '12 at 22:10
3

+1 to @PeterFlom for an excellent (and concise) answer that hits the main points. As Peter correctly points out, using backward elimination as a model selection technique will lead to a lot of problems. It may be helpful to you to understand why that is true. My answer to a similar question here might be useful in that regard.

I wanted to say a couple other things to complement Peter's answer. First, since your predictors are counts, it may be worthwhile to take the log before using them. This is often done with counts. Basically, the idea would be that there are diminishing returns: going from 5 mentions in a given day to 10 is a bigger jump than going from 155 to 160. It is always possible that this isn't true, but it's something to think about. There is a lot of good information about the use and effects of the log transformation here.

My other note is that reducing the number of predictor variables in the manner you go about it may not be strictly necessary. A different approach is to combine predictors before looking at the response variable. For example, it may be possible to conduct a factor analysis on your predictor variables and then use just a handful of robust factors as the predictors in your model. This could provide some of the benefits you hope for without the problems Peter mentions.

gung - Reinstate Monica
  • 132,789
  • 81
  • 357
  • 650