1

@vucko gave me excellent answer on my question, unfortunately using Mathematica code. I'm trying to rewrite it in R and I'm lost in R functions providing kernel density estimation.

I have bivariate dataset with more than 46,000 rows (so I am also looking for a high performance solution--@vucko's solution is very time consuming). I would like to apply kernel density estimation and decide if some point lies in area with some density estimation level (confidence level respectively).

kernel estimate

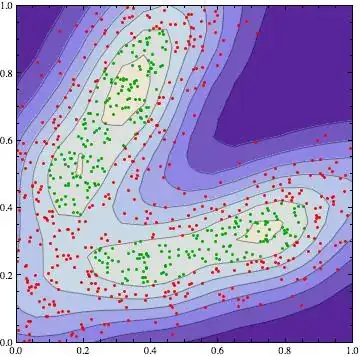
@vucko in his answer selected two groups. I need only to know if some point lies in the green group or not. And that should be done with R.

I experimented with kde and bkde2D functions but they don't provide me desired functionality as Mathematica SmoothKernelDistribution. Can you please me show the direction? For normal distribution I found the ellipse function which approximated data with some confidence level and used inside.owin function.

matejuh
  • 315
  • 1
  • 2
  • 8
  • Some people find that `SmoothKernelDistribution` goes quite quickly; I have found it will take a few seconds with $10^4$ points. See the response and comments at http://mathematica.stackexchange.com/a/2967. – whuber Mar 14 '12 at 22:19
  • You might try the `feature` package. – Wayne Mar 14 '12 at 18:19
  • Feature `featureSignif` produces the same as bkde2D- fhat matrix which I don't know, how to use... – matejuh Mar 14 '12 at 19:45

1 Answers1

3

I think the hdrcde package does what you want. Here is something quite similar to your example:

require(hdrcde)
n <- 23000
x <- c(runif(n,0,1),runif(n,0,.6))
y <- c(x[1:n], 7*x[n+(1:n)]) + rnorm(n)
y <- (y-min(y))/(max(y)-min(y))
plot(x,y)

den <- hdr.boxplot.2d(x,y,prob=.30,h=c(2.,2),pch=".",pointcol="red")
j <- (den$fxy > den$falpha)
points(x[j],y[j],col="green",pch=".")

That will give you the points within the contour of 30% probability. It is very fast, even with 46000 observations.

Rob Hyndman
  • 51,928
  • 23
  • 126
  • 178
  • The prob=0.30 argument controls the confidence area. – Rob Hyndman Mar 14 '12 at 23:26
  • I gives me strange result. I don't know, how to control the confidence area. My result with straight use of your code on my data looks like: [wrong result](https://github.com/matejuh/doschecker_wiki_images/raw/master/consultation/stats/err.png) What I actually needs is when I have some data with kernel density estimation like: [kernel](https://github.com/matejuh/doschecker_wiki_images/raw/master/consultation/stats/kernel.png) And if I have point x[100000,3000] I would like to decide if it lies in azure confidence level or bigger. – matejuh Mar 14 '12 at 23:30
  • Thanks for response @Rob Hyndman, sorry I add comment before I finished it... I know that prob controls the confidence area, but it has very wheard behaviour on my data. – matejuh Mar 14 '12 at 23:33
  • Most likely you need to modify the bandwidth for the density estimation. That is controlled by the h argument. – Rob Hyndman Mar 14 '12 at 23:33
  • Is there any automatic way how to do it? When I used it with `bkde2D` I just tested some values. – matejuh Mar 14 '12 at 23:44
  • Yes, but they are not implemented in `ash()` which is what this is using for the density estimation. Other implementations of bivariate density estimation do have automatic bandwidth selection, but they are much slower and given your data size I thought ash would be better. It is not hard to try values of h until you get something looking reasonable. – Rob Hyndman Mar 15 '12 at 00:00