In my previous question I needed to help with ellipse region extraction and determine if point lies in that region or not. I ended up with this code:
library(ellipse)
library(mvtnorm)
require(spatstat)

netflow <- read.csv(file="data.csv",head=FALSE,sep=" ")
#add headers
names(netflow)<-c('timestamps','flows','flows_tcp','flows_udp','flows_icmp','flows_other','packe ts','packets_tcp','packets_udp','packets_icmp','packets_other','octets','octets_tcp','octets_udp','octets_icmp','octets_other')
attach(netflow)

#load library
library(sfsmisc)
#plot
plot(packets,flows,type='p',xlim=c(0,500000),ylim=c(0,50000),main="Dependence number of flows on number of packets",xlab="packets",ylab="flows",pch = 16, cex = .3,col="#0000ff22",xaxt="n")
#Complete the x axis
eaxis(1, padj=-0.5, cex.axis=0.8)

pktsFlows=subset(na.omit(netflow),select=c(packets,flows))
head(pktsFlows)
#plot(pktsFlows,pch = 16, cex = .3,col="#0000ff22")

cPktsFlows <- apply(pktsFlows, 2, mean)
elpPktsFlows=ellipse::ellipse(var(pktsFlows),centre=cPktsFlows,level=0.8)

png(file="graph.png")
plot(elpPktsFlows,type='l',xlim=c(0,500000), ylim=c(0,50000))
points(pktsFlows,pch = 19, cex = 0.5,col="#0000FF82")
grid(ny=10,nx=10)
dev.off()

W <- owin(poly=elpPktsFlows)
inside.owin(100000,18000,W)
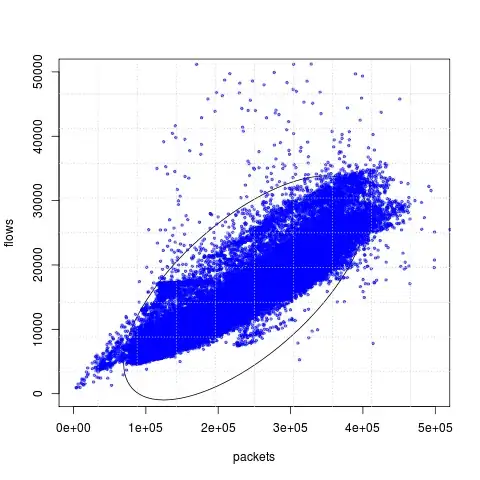
This produces this graph.
Here is the same data with the regression line plotted
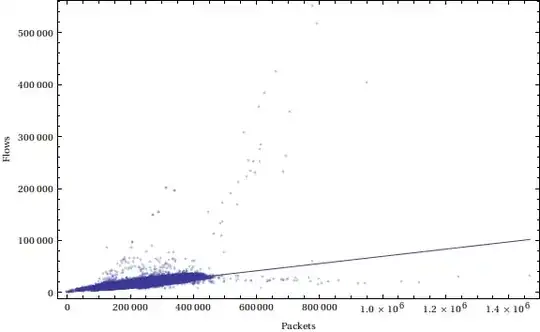 .
.
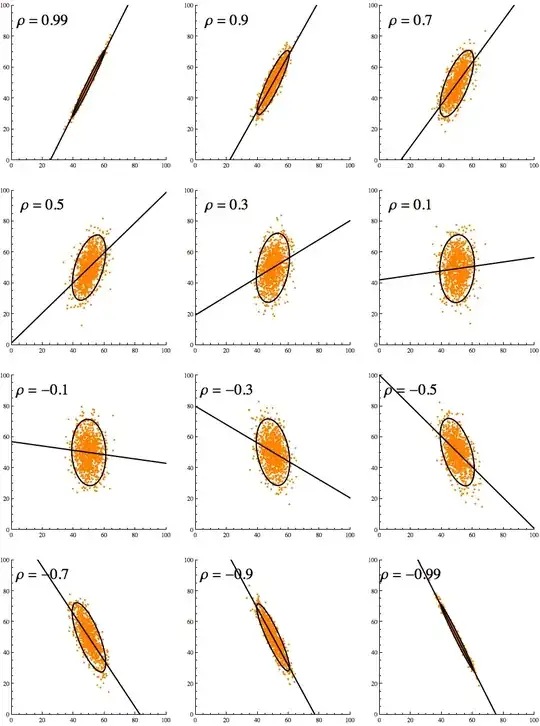
Can you explain me, why the ellipse has this shape? I expected that main axe of ellipse will have the same direction with linear regression line, but it hasn't.
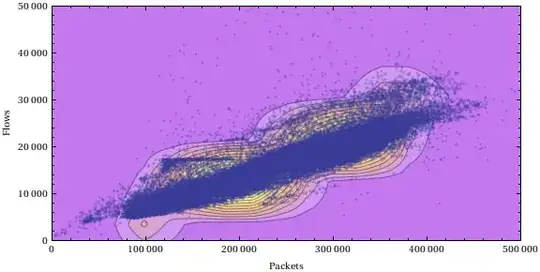
Btw. kernel density estimation also points to 100000 althought there are no points...