Age pyramid looks like this:
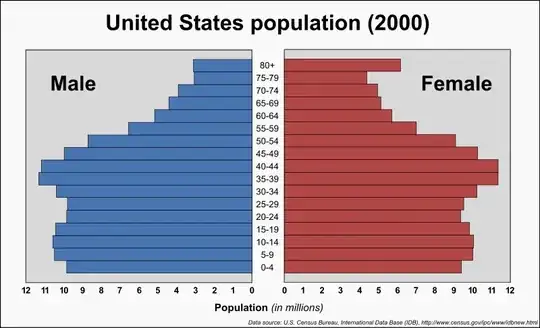
I would like to make something similar, namely a 2 barplots (not histograms) with same categories, rotated vertically and extending to both sides as in pyramid.
Is it a simple way to do this in R?
It would be also nice to control the colour of each bar.
Asked
Active
Viewed 1.8k times
14
1 Answers
21
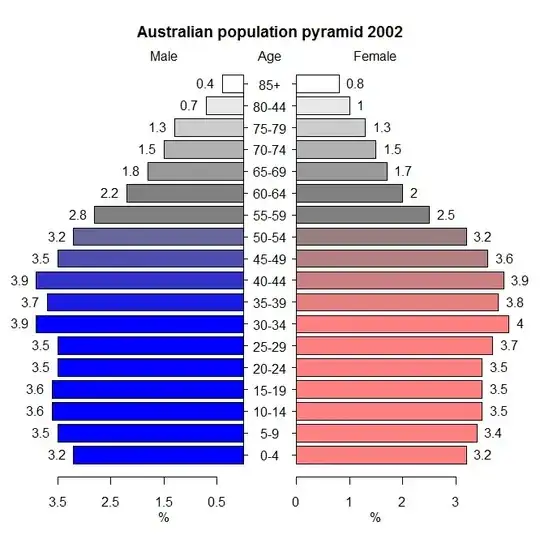
You can do this with the pyramid.plot() function from the plotrix package. Here's an example:
library(plotrix)
 xy.pop<-c(3.2,3.5,3.6,3.6,3.5,3.5,3.9,3.7,3.9,3.5,3.2,2.8,2.2,1.8,
  1.5,1.3,0.7,0.4)
 xx.pop<-c(3.2,3.4,3.5,3.5,3.5,3.7,4,3.8,3.9,3.6,3.2,2.5,2,1.7,1.5,
  1.3,1,0.8)
 agelabels<-c("0-4","5-9","10-14","15-19","20-24","25-29","30-34",
  "35-39","40-44","45-49","50-54","55-59","60-64","65-69","70-74",
  "75-79","80-44","85+")
 mcol<-color.gradient(c(0,0,0.5,1),c(0,0,0.5,1),c(1,1,0.5,1),18)
 fcol<-color.gradient(c(1,1,0.5,1),c(0.5,0.5,0.5,1),c(0.5,0.5,0.5,1),18)
 par(mar=pyramid.plot(xy.pop,xx.pop,labels=agelabels,
  main="Australian population pyramid 2002",lxcol=mcol,rxcol=fcol,
  gap=0.5,show.values=TRUE))
Which ends up looking like this:
Shane
- 11,961
- 17
- 71
- 89
-
Ok, indeed I rewrote it completely to have different scales on both sides, but it seems there is nothing in R that can do it natively. – Sep 09 '10 at 13:24
-
I'm sure that you could do it with ggplot2, but it would require a little effort. – Shane Sep 09 '10 at 13:44
-
@mbq Also FYI there is a pyramid chart capabilities in the [HH package](http://www.inside-r.org/packages/cran/HH/docs/as.pyramidLikert). This [question on the site gives](http://stats.stackexchange.com/a/25156/1036) examples for Likert type data, which I imagine can be hacked to produce similar bar charts. In ggplot2 one would need to display reflected counts, an easy way is to just have one bar be negative and the other be positive (not sure if ggplot2 supports mirrored dimensions like pyramid plots though). – Andy W Feb 03 '13 at 14:45