0

I am interested in finding the mixture of distributions (Beta in my case) which best fits what is effectively a empirical pdf.

The data is actually instrument output and due to the nature of the technique individual observations are not recorded, but instead the count of observations at a particular value is returned.

Most approaches for fitting mixtures to data begin with the actual sample - is there a more appropriate starting point when the empirical pdf is the known?


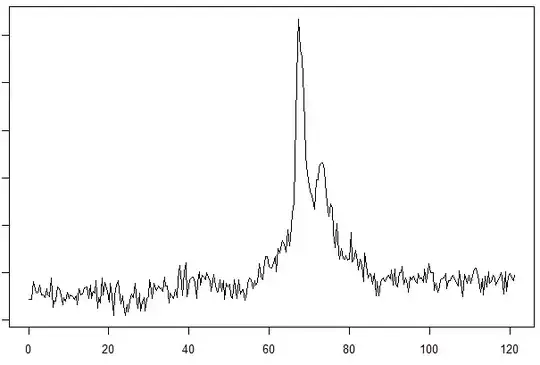
Below I have included some plots of the data. To be upfront, the x axis is time, but is better understood as a measure of a chemical property that can be expressed continuously. Components have discrete values in x, but elute as distributions due to to various non-ideal effects in the experiment. I am trying to recover the individual components, but more realistically to separate the well resolved components and the noise depicted as a fluctuating baseline in figure 3.

I am open to criticism regarding the approach as well, but no effective tools exist in my field to achieve this and after evaluating many other attempts I think this approach may be at least functional if not statistically valid.
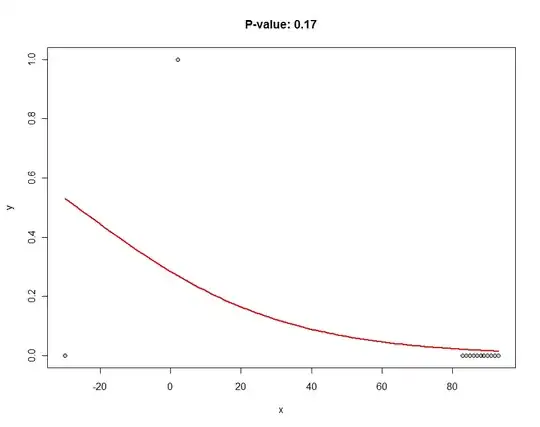
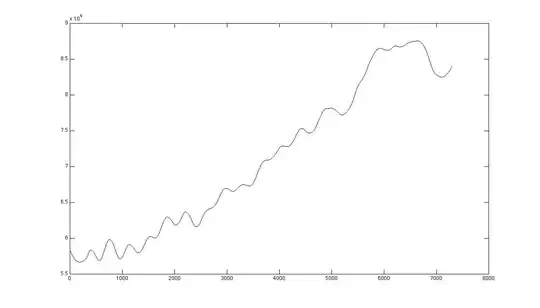
Example density Example density 2 Noisy density 3

dsaxton
  • 11,397
  • 1
  • 23
  • 45
nate
  • 171
  • 9
  • 2
    Why beta? It does not seem that your data fits some closed interval. As about fitting, there are many possible ways to obtain it: (1) if you have counts (is your data discrete?) then you can repeat each $x_i$ by it's counts and you'd have exactly the same data in different form; (2) you could sample $x_i$'s with $p_i$ probabilities (empirical frequencies); (3) you could fit some function by minimizing the distance to frequencies (e.g. using $\chi^2$ statistic as a discrepancy measure). – Tim Nov 01 '16 at 18:14
  • Hi Tim, thanks for your suggestions on getting a sample from my pdf. That certainly makes sense and contains the same information. This also allows me to use established mixture fitting techniques. I chose beta because it is a convenient distribution to allow for positive and negative skew. In terms of fitting to the Beta I am planning on normalizing my data to (0,1). – nate Nov 01 '16 at 18:40
  • Could you comment on the pros and cons of each method - fitting the frequencies by minimizing \chi^2 seems most efficient - if I generate the sample from this data I have many more data points and no increase in information (here the pdf is not an approximation but is exact). Still, this type of fitting seems less discussed in my reading. My data has counts in the millions, and is better thought of as continuous. – nate Nov 01 '16 at 18:45
  • but Does your data have a finite range (i.e. it is *impossible* that values fall below min and max)? If no, then beta is inappropriate. – Tim Nov 01 '16 at 18:49
  • If I understand correctly, yes it is impossible for my data to have values below 0 and above 3600. But maybe I'm missing the point - what implications will using an inappropriate distribution have? – nate Nov 01 '16 at 18:52
  • If you know the empirical cdf, you know the sample up to a random permutation. – Xi'an Nov 01 '16 at 20:18

0 Answers0