4

Why can we not define a 3D rank correlation as the elongation of the cloud as a proportion of the multidimensional variance as an extension of the 2D rank correlation case as suggested by @gung?

There are several attempted answers to a related question in Spearman's Rank-Order Correlation for higher dimensions. However, those answers appear to skirt the issue. This question is a cleanup and an attempt to collate other questions. Please hold off on changing this question at least until the matter is clarified. If this question is a duplicate, then the two questions it refers to are also duplicates. There have been several other questions posted on this site that could be answered by extending Spearman's rank correlation to 3D:

correlation among variable per observation

Aggregation of Correlations Coefficients (Spearman)

I do not see why it could not be done. Has it? If not, would someone please extend Spearman's rank to 3D, please?
Carl
  • 11,532
  • 7
  • 45
  • 102
  • What is the correlation between? – Nick Cox Oct 24 '16 at 21:04
  • @NickCox Between triple rankings, as per the links provided, or really among any other triple. Obviously, one can provide two independent variables to predict an dependent one in different three ways, and there may be other ways to understand this, for example, one dependent variable to predict two independent variables in three different ways, or reduce the dimensionality between either two dependent variables or two independent variables in six different ways. – Carl Oct 24 '16 at 21:18
  • @NickCox What might be best would be the most self-consistent way of obtaining a single rank correlation, or perhaps three rank correlations, if not self-consistent. – Carl Oct 24 '16 at 21:18
  • 1
    Sorry, but that doesn't seem to answer my question. If Spearman rank applies to any reduction of three variables, then it's equivalent to a single rank correlation between two beasts of some kind. Otherwise the question is just asking for a unicorn. Note that any distinction between dependent and independent is alien to the idea of correlation. – Nick Cox Oct 25 '16 at 09:13
  • @NickCox When correlation refers to standardized covariance, which variable is conversationally considered to be dependent is arbitrary, irrelevant and not a detractor, as it changes nothing. So, you are saying that covariance cannot be standardized in 3D, do tell us why that is again? – Carl Oct 25 '16 at 15:51
  • 1
    I am not saying that. But covariance in 3D is a matrix not a scalar and I don't understand what kind of reduction to a scalar you seek. – Nick Cox Oct 25 '16 at 16:01
  • Covariance in 2D is a matrix, and [extends logically to higher dimensions](https://en.wikipedia.org/wiki/Covariance_matrix). – Carl Oct 25 '16 at 16:07
  • @NickCox I am seeking 3D normalized covariance, see added formula in question above which is not meant to be correct, just to provide an indication that there is nothing extraordinary about adding a variable. – Carl Oct 25 '16 at 16:16
  • 3
    Possible duplicate of [Spearman's Rank-Order Correlation for higher dimensions](http://stats.stackexchange.com/questions/189349/spearmans-rank-order-correlation-for-higher-dimensions) – dsaxton Oct 25 '16 at 16:45
  • 3
    Like @NickCox, I'm not sure what you're asking for here. Consider a simpler situation. Say you have multivariate normal data in 3D, what would you want to say then? Some people might want to know the 3x3 variance-covariance matrix, some might want to know the elongation of the cloud as the proportion of the multidimesional variance that is accounted for by the 1st principle component (ie, 1st eigenvalue / 3), some might want to know the determinant, etc. What is it you would want & why, then we can think of how to connect that to this context. – gung - Reinstate Monica Oct 25 '16 at 17:12
  • @gung There are two questions linked to in the text of my question. They are asking for something. What would you have me do? – Carl Oct 25 '16 at 17:18
  • 2
    Unfortunately we don't find these questions to be precise. Each asks for an extension. The comments are cycling round and round quite what kind of extension you have in mind. For example, a fairly trivial answer is that you can easily have a matrix of Spearman correlations. – Nick Cox Oct 25 '16 at 17:30
  • 2
    I just read the 2 linked Qs. Unfortunately, they don't help me understand what you're after. What I'm trying to find out is what kind of animal your possible $r_{3D}$ is. Without that, I don't see how this can be answered. – gung - Reinstate Monica Oct 25 '16 at 17:30
  • @gung I sympathize, same problem I had. I would think that the elongation of the cloud as a proportion of the multidimensional variance would be the most logical extension. The other answers, for example, the matrix of Spearman's correlations would certainly be of interest as well. I think the problem here is that people asking these questions want *something* and we can give them something. If they knew exactly what they wanted, they would ask. I am rather fond of the first approach above, seems most interesting. – Carl Oct 25 '16 at 17:40
  • 1
    I would edit that information (prominently) into the text of your question. I agree that that is the simplest & clearest possibility. However, I'm not sure if it would actually work (or at least is guaranteed to work) for Spearman's correlations b/c of the nonlinear transformation into ranks. W/ a small number of ordinal categories, it certainly does work for polychoric correlations, though--if you are willing to assume latent normality. – gung - Reinstate Monica Oct 25 '16 at 18:55
  • 3
    Until you stipulate what property of multidimensional data you are attempting to characterize, this question appears to be too vague to be answerable. – whuber Oct 25 '16 at 22:56
  • @whuber Question made more precise. I do not see that question answered elsewhere, but, do correct me if I am wrong. – Carl Oct 26 '16 at 00:17
  • @gung Thanks for the help (+1), is the question acceptable now? – Carl Oct 26 '16 at 01:33
  • IMO, yes; I voted to reopen. We'll see what others think – gung - Reinstate Monica Oct 26 '16 at 01:56
  • Even in its extended form, it is unclear to me why this question is distinct from http://stats.stackexchange.com/questions/189349/spearmans-rank-order-correlation-for-higher-dimensions ... anything being discussed in the comments here as a possible answer would appear to be just as good an answer there, which suggests the threads are duplicate – Silverfish Oct 26 '16 at 07:57
  • @Silverfish For http://stats.stackexchange.com/questions/189349/spearmans-rank-order-correlation-for-higher-dimensions it is true that the answers are in the correct vein. The question here is clearly 3D, and is is distinct. That other questioner offers, "... since I cannot simply fix y and look upon it as data of the form $(x_i,z_i)$," which is not an actual 3D question. The other elephant in the room are the linked duplicate questions, which you and the other closure voters ignore. Respond to that issue constructively or withdraw your incomplete closure objection. – Carl Oct 26 '16 at 15:28
  • @Carl It seems to me (though clearly you see it otherwise) that this quote doesn't so much render the other question "not an actual 3D question", as explain why the OP on that question has resorted to seeking a 3D analogue to Spearman's rather than stuck to 2D. The heart of that question still seems to be "My question: is it also possible extend this to higher dimensions?" – Silverfish Oct 26 '16 at 16:21
  • @Silverfish I am trying to organize questions and answers. Before we dispose of this question, please answer as to "What should be done with the other questions?" – Carl Oct 26 '16 at 16:49
  • The question should be clear in edited form, vote to reopen and do answer what to do with the other, much less clear questions, without picking this question out of a cloud of clouded others, please. – Carl Oct 26 '16 at 17:08
  • 3
    Although I voted to reopen, I have no clue what you might mean by "the most logical": that looks like a subjective criterion. Once again I would request that you attempt to describe what property of the distribution you are hoping to characterize. – whuber Oct 26 '16 at 18:15
  • @whuber Many thanks. "the most logical" deleted, however, the sentence now lacks motivation. I considered saying something like "the most self-consistent extension to the three dimensional case," which is what I meant by most logical, but, given that application contexts can be different, the mathematically obvious is not always the applicable case. – Carl Oct 26 '16 at 18:32
  • 2
    Like some of the other commenters, it is not clear to me what property of the joint distribution of 3 (or more) variates you are looking to characterize, but you might be looking for the notion of [conditional or partial (rank) correlation](https://www.jstor.org/stable/2333539). – tchakravarty Oct 26 '16 at 18:46
  • @tchakravarty I was thinking more along the lines of [total correlation](https://en.wikipedia.org/wiki/Total_correlation). A single correlation for the 3D case. – Carl Oct 26 '16 at 19:37
  • +1 Carl I like that you are trying to inquire after a challenging idea with this question. I think that the clarifications requested by the folks in the commentary are useful, but I like that you are just trying to push into new idea realm, and think we should have room for this on CV. – Alexis Apr 15 '18 at 00:43

1 Answers1

1

Since Spearman correlation in 2D is equivalent to the Pearson correlation between the ranks, and since the $R^2$ is (well, kind-of) the generalization of the Pearson correlation to multiple regression, maybe we can use the $R^2$ of the ranks?

I tried playing with this a bit in R, not sure I can come with any conclusive results.

Remember that Spearman will only find monotonic relations, so the function probably must also be monotonic in each dimension, e.g. $e^{x+y}$.

Here's a code example:

x1 = seq(0.01, 10, 0.1)
x2 = seq(0.01, 10, 0.1)
grid <- expand.grid(x1=x1,x2=x2)
y = exp((grid$x1)/2+(grid$x2)/2)+ rnorm(length(grid$x1),0,100)

library(plotly)
z <- y2
dim(z) <- c(100, 100)
fig <- plot_ly(x=~x1, y=~x2, z =~z)
fig <- fig %>% add_surface()
fig

enter image description here

# Regular linear-regression
mod1 = lm(y ~ grid$x1 + grid$x2)
summary(mod1)$r.squared # [1] 0.4158116

# Linear regression of the ranks
n   <- length(grid$x1)
rx1 <- rank(grid$x1)
rx2 <- rank(grid$x2)
ry  <- rank(y2)
mod2 = lm(ry ~ rx1 + rx2)
summary(mod2)$r.squared  # [1] 0.7485

Though Spearman seems to also be worse, if I increase the variance from 100 to 1000 (0.328 in the regular $R^2$, 0.2547 in the $R^2$ of the ranks).

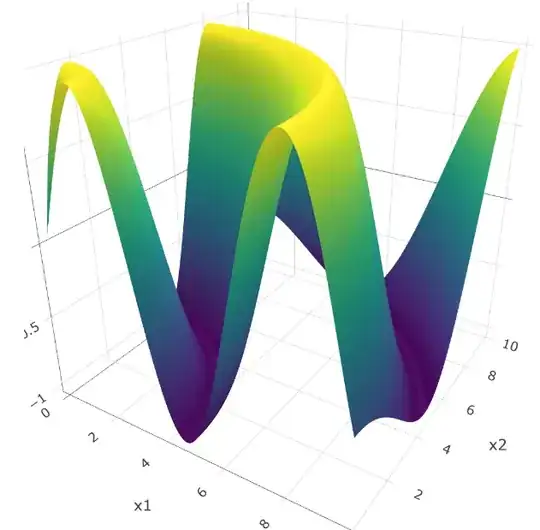
If I use a non monotonic function, e.g. $\sin(\sqrt{x^2+y^2})$ even without noise enter image description here

both measures seem to be around zero.

I'm reading now a paper by Chatterjee, "A New Coefficient of Correlation", where he introduces an improved rank correlation he denotes as $\xi$. He mentions that "Multivariate measures of dependence and conditional dependence inspired by ξn are now available in the preprint (Azadkia and Chatterjee 2019)". So you might want to check these out.

Maverick Meerkat
  • 2,147
  • 14
  • 27
  • OK, will look. Rs and monotonicity are not strict. For example, even if one starts with a monotonic function, in simulation noisy results may not be monotonic. True enough, the more monotonic the better. – Carl Mar 10 '21 at 00:04