The standard way to visualize categories against multiple variables would be to use a scatterplot matrix, and to represent the categories distinctly using different colors, symbols, or both. Here is an example for the iris data:
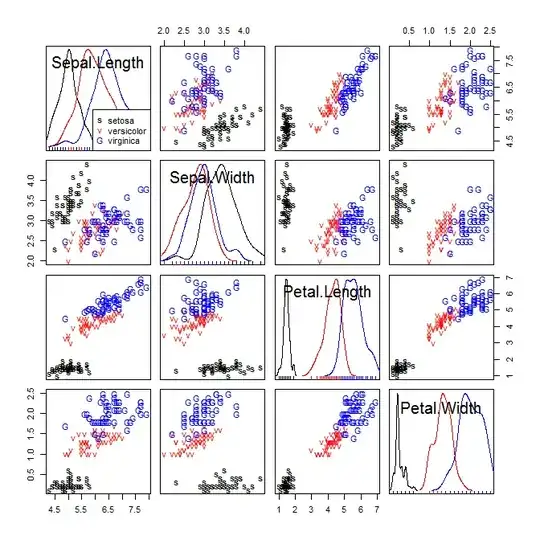
You are right that it can be difficult to distinguish the categories. The first suggestion here is not to use red and green, as ~10% of men are red-green colorblind. Since we only need three colors here, I use black, red, and blue. Various 'colorblind friendly palettes' can be found here.
Regarding the symbols, Bill Cleveland listed some markers that are maximally discriminable in his books (1, 2). Another possibility is to use symbols that are intrinsically meaningful. In your case, you simply write out the full names of the irises. That can work, but long names can overlap and become harder to distinguish, so there is a tradeoff to consider. Here I used "s" for setosa, "v" for versicolor, and "G" for verginica, as a compromise.
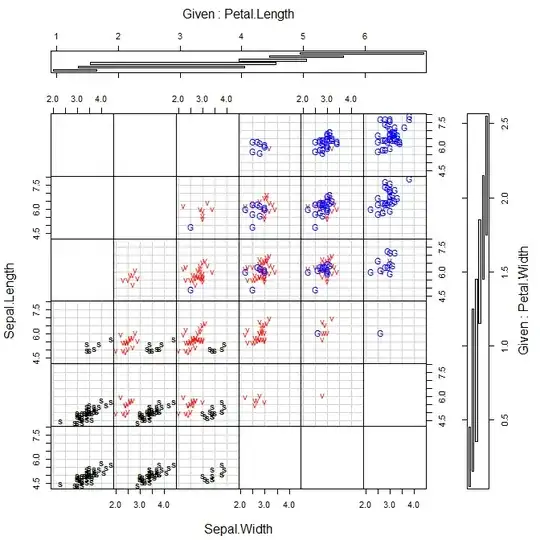
Another possibility is to make a coplot. This will work for situating the data in up to a 4-dimensional space (which is what we have here, fortunately enough). This is also a set of scatterplots, but here each plot represents the data within a given stratum specified for each of the other two variables. For the iris data, we can see that setosa reside at lower values of petal length and width, but that the sepal length by width pattern does not vary as a function of petal lengths and widths.
For your plot, you have values that are rounded to manageable units and have created something like a heatmap. I understand your argument for why you prefer this, but I don't think it's best. First, you have only two numerical variables represented. You could try to create these within a matrix, but the names will cease to be readable and you will end up with something very much like a scatterplot. In addition, rounding loses the granular detail in your data. The iris data were rounded already, possibly when Anderson collected them, but for example, in your plot, you cannot see that there is a verginica at (1.8, 4.8) because there is a versicolor on top of it. Consider:
iris[c(71,127),3:5]
#     Petal.Length Petal.Width    Species
#  71          4.8         1.8 versicolor
# 127          4.8         1.8  virginica
You also mention contour plots. That can be done, but if your data aren't so numerous and/or don't overlap so much that they are indistinguishable then I think it's better to just display the actual data. When you do have lots of data, contours could be plotted instead of, or in addition to, the data, but there are also other options (see my answer here: How to extract information from a scatterplot matrix when you have large N, discrete data, & many variables?).


