5

I was searching on this forum to calculate the p value from a t.test score.
So I found this topic.
The answer giving:

> 2*pt(ttestscore, lower=FALSE) 

However it makes no sense to me using the lower = FALSE.
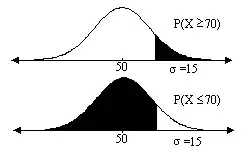
enter image description here

When using the lower = F argument you will calculate the probability of the black shaded area in the second figure right?

This means that you are calculating the probability that the t score is LESS then the giving t score, but you want to calculate the probability that the T score is bigger (if you are giving the t score as a positive number)?

KingBoomie
  • 683
  • 4
  • 7
  • 20
  • 3
    The argument is `lower.tail` and if set to `FALSE` the function gives the upper tail probability just as you'd expect and as the documentation says. Type `?pt` in the R console. – dsaxton Oct 04 '16 at 17:43
  • You may find vonjd's answer in that thread relevant. In particular consider these two (equivalent) alternative versions, the first being his code: 1:... `p.value = 2*pt(-abs(t.value), df=length(data)-1)` ... $\qquad\quad\:\:$ 2: ... `p.value = 2*pt(abs(t.value), df=length(data)-1,lower.tail=FALSE)` – Glen_b Oct 04 '16 at 22:23

2 Answers2

8

Check out the documentation for R's pt() function.

lower.tail
logical; if TRUE (default), probabilities are P[X ≤ x], otherwise, P[X > x].*

In other words, when lower.tail=FALSE you get the probability to the right of X (the first of your two diagrams).

Or just run it for yourself:

> pt(2,10)  
[1] 0.963306  
> pt(2,10,lower.tail = FALSE)  
[1] 0.03669402  
Waldir Leoncio
  • 2,137
  • 6
  • 28
  • 42
Charles Eliot
  • 228
  • 1
  • 8
0

Student t distribution is symmetric. So if you calculate the area under upper tail and multiply it by 2, you end up with the 2 tailed p-value of your test score.

Theoden
  • 407
  • 3
  • 11