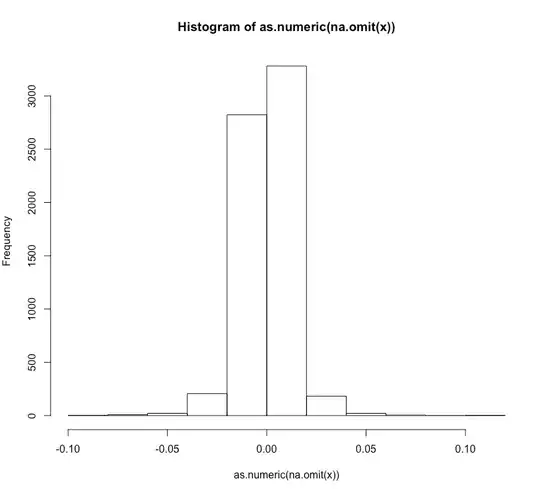
This is a widely studied problem in quantitative finance. You've selected and posted only one year worth of data. If your time series was extended back to 2007, you would see ever greater divergence in your chart with the inclusion of the market crashes back then.
Returns are well known not to be normal, log normal or even t-distributed. All three distributions show significant lack of fit vis-a-vis returns. There's the famous story, perhaps told best by David Hand in his book The Improbability Principle (p. 147), of the Goldman-Sachs CFO who testified in Congress after 2007 that, based on the normal distribution, the recent financial shocks were "25-standard-deviation events, several days in a row." The fact is that, based on the normal, there isn't enough time in the history of the universe to capture a 1 in 25-sigma event probability. Thus, it's no surprise that the Jacques-Bera would reject an assumption of normality...but then, the J-B rejects normality almost every time it's applied.
Hand goes on to note, "If the distribution of market fluctuations isn't normal, it must have some other shape." His suggestion of a better fit to stock returns is the Cauchy distribution. And he provides a table comparing the normal and the Cauchy in terms of the probabilities of event moves. Based on this table, it's evident that we should expect rare events to occur with much greater frequency:

As @glen_b notes, Q-Q plots are a sensible way to examine and compare fit or the lack of it. Another approach that is quite useful with extreme valued information is to estimate a tail index. The literature concerned with extreme value theory is quite large and estimands of this index include Hill and Pickand's methods -- both computationally intensive. A more straightforward heuristic is to leverage Gabaix's OLS-based approach using the log of the ranks of the data as described in his paper Rank - 1/2: A Simple Way to Improve the OLS Estimation of Tail Exponents. (An ungated copy can be found here: http://www.eco.uc3m.es/temp/jbes.2009.06157.pdf). Gabaix contends that his approach is mathematically well-founded but it's not without controversy. For instance, Shalizi argues in his presentation So You Think You Have a Power Law Do You? (an ungated copy can be found here http://www.stat.cmu.edu/~cshalizi/2010-10-18-Meetup.pdf), that OLS estimators of tail exponents are "bad practice." I won't take sides on this, you be the judge.
Once one has estimated a tail exponent, there's a bit of a cheat sheet on this Wiki page about Tweedie Distributions. Look under "Examples," where the magnitude of the index is aligned with possible explanatory, extreme valued distributions (https://en.wikipedia.org/wiki/Tweedie_distribution).
One individual who has thought and continues to think deeply about the implications of extreme market moves is Didier Sornette, now Chair of the Financial Crisis Observatory at ETHZ. His 2004 book Why Stock Markets Crash: Critical Events in Complex Financial Systems is a superb overview on the manifold complexities in analyzing stock returns. In addition, his ETHZ website has many, many more papers examining a huge many other aspects of these problems. The sophistication of Sornette's views on markets, bubbles and risk more than repays the effort involved in understanding them.
Other useful observers, practitioners and developers of EVT (extreme value theory) include Paul Embrechts, also at ETHZ, whose 1996 book Modeling Extreme Events remains a classic and the bible in the field. Then, there's always Nassim Taleb whose free book Silent Risk can be downloaded from his website: https://fernandonogueiracosta.files.wordpress.com/2014/07/taleb-nassim-silent-risk.pdf. Taleb can be a bit of a blowhard but his views, while always controversial, are widely cited.
To summarize and answer your query, it is definitely not the case that "no distribution summarizes your data." You've been given a variety of tools and resources to tackle this problem in these responses. So, go out and pick a distribution, then motivate it.


