8

I want to regress the fuel economy on engine displacement, fuel type, 2 vs. 4 wheel drive, horsepower, manual vs. automatic transmission, and the number of speeds. My data set (link) contains vehicles from 2012-2014.

  • fuelEconomy in miles per gallon
  • engineDisplacement: engine size in liters
  • fuelStd: 1 for gas 0 for diesel
  • wheelDriveStd: 1 for 2-wheel drive, 0 for 4-wheel drive
  • hp: horsepower
  • transStd: 1 for Automatic, 0 for manual
  • transSpeed: Number of speeds

R-code:

reg = lm(fuelEconomy ~ engineDisplacement + fuelStd + wheelDriveStd + hp + 
                       transStd + transSpeed, data = a)
summary(reg)
Call:
lm(formula = fuelEconomy ~ engineDisplacement + fuelStd + wheelDriveStd + 
    hp + transStd + transSpeed, data = a)

Residuals:
     Min       1Q   Median       3Q      Max 
-10.2765  -2.3142  -0.0655   2.0944  15.8637 

Coefficients:
                    Estimate Std. Error t value Pr(>|t|)    
(Intercept)        48.147115   0.542910  88.683  < 2e-16 ***
engineDisplacement -3.673549   0.091272 -40.248  < 2e-16 ***
fuelStd            -6.613112   0.403989 -16.370  < 2e-16 ***
wheelDriveStd       2.778134   0.137775  20.164  < 2e-16 ***
hp                 -0.005884   0.001008  -5.840 5.86e-09 ***
transStd           -0.351853   0.157570  -2.233   0.0256 *  
transSpeed         -0.080365   0.052538  -1.530   0.1262    
---
Signif. codes:  0 ‘***’ 0.001 ‘**’ 0.01 ‘*’ 0.05 ‘.’ 0.1 ‘ ’ 1

Residual standard error: 3.282 on 2648 degrees of freedom
  (1 observation deleted due to missingness)
Multiple R-squared:  0.7802,    Adjusted R-squared:  0.7797 
F-statistic:  1566 on 6 and 2648 DF,  p-value: < 2.2e-16
  1. Are the results realistic or am I doing something wrong here as most of the variables are highly statistically significant?
  2. Are other models better to use for this purpose?
  3. Is such a result usable for interpretation?
Robert Long
  • 53,316
  • 10
  • 84
  • 148
Bert
  • 91
  • 1
  • 4

4 Answers4

6

I know very little about the mechanics and physics involved, but the first thing I would look at is the regression diagnostics, in particular, the plots of residuals vs fitted values, for which we would like there to be no overall pattern.

You have fitted a linear model so that each covariate has a linear association with fuelEconomy . Is this supported by the underlying mechanical and physical theory ? Could there be any nonlinear association(s) ? If so then you could consider models with nonlinear terms, transforming certain variables, or you could consider using an additive model. Even if the associations are plausibly linear within your actual dataset, be very wary of extrapolating the results beyond your data limits.

Robert Long
  • 53,316
  • 10
  • 84
  • 148
6

@AntoniParelleada has done a good job demonstrating some of the standard model diagnostic techniques that you can use to evaluate your model. I gather your primary concern is that "most of the variables are highly statistically significant".

I don't see that you need to be concerned about that, per se. From your output I see that the model has an F-statistic: 1566 on 6 and 2648 DF. That means that you are fitting $6$ parameters for $6$ variables and have $2655$ data. This gives you an enormous amount of statistical power. Under the assumption that there is any relationship between your variables and the response, that isn't completely trivial, you should get a significant result. I'm more surprised that anything (namely transSpeed) is not significant.

Perhaps your question is motivated by the belief that, from theoretical perspective, some variable should be unrelated to fuelEconomy and you are thus surprised that it is significant. (If that were true, however, it would have been unusual to have included it in the model.) But a significant result doesn't necessarily mean that a covariate has an effect on the response, so this needn't be a type I error. Because your data are almost certainly observational, you are only detecting marginal associations. That is, cars that have front wheel drive, for example, may also typically differ from rear wheel drive cars in ways other than which wheels transmit power and other than the other variables included in the model. Thus, the coefficient for wheelDriveStd would measure the association between it and all the unincluded variables correlated with it and fuelEconomy. So it can be reasonable for it to be significant even if we knew from the physics / engineering that which wheels transmit power is unrelated to fuel efficiency.

gung - Reinstate Monica
  • 132,789
  • 81
  • 357
  • 650
  • I have more machine learning knowledge than statistics. Can we say, if we have large data say million rows and thousand columns, no one care about the feature "significance" any more? – Haitao Du Sep 13 '16 at 20:32
  • 3
    I wouldn't necessarily characterize it that way, @hxd1011. If there truly is no association, the type I error rate will still be .05, so someone could still care, but you will have enough power to detect even very trivial effects. As an analogy, it might help to read [Is normality testing 'essentially useless'?](http://stats.stackexchange.com/q/2492/7290) – gung - Reinstate Monica Sep 13 '16 at 21:12
  • Really informative. I wonder if there is any one-liner that you could add to give some reference / perspective for us to get an intuitive grasp of your assertion about the enormous amount of statistical power based on the F statistic. – Antoni Parellada Sep 13 '16 at 21:26
  • 2
    It's just that $N = 2,655$ is *a lot* of data, @AntoniParellada. – gung - Reinstate Monica Sep 13 '16 at 21:28
  • Thank you! With statistics I always assume there has to be more "hidden"... :-) – Antoni Parellada Sep 13 '16 at 21:31
5

A scatterplot matrix with loess curves and correlation values (absolute values) can be a good starting point:

enter image description here

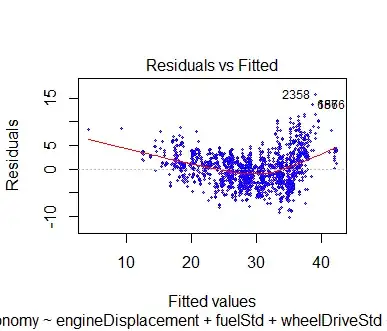
We can notice here the possibly quadratic relationship of fuelEconomy plotted against both lineDisplacement and hp, which is also reflected in a Nike swoosh appearance in of the residual plot. It would be interesting to investigate the presence of an interaction between these term.

enter image description here

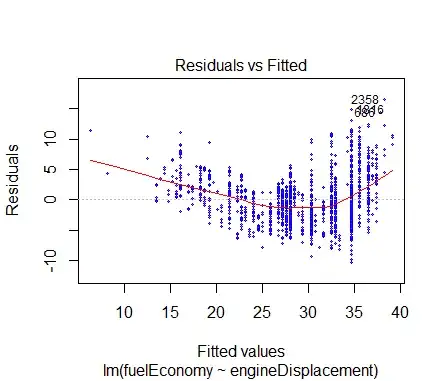
This lack of linearity is also apparent if we run a linear regression of fuelEconomy against linearDisplacement (similar results can be obtained with hp). Notice the red line...

enter image description here

This effect can be partially rectified making the model more complex, and introducing a quadratic model:

enter image description here

The new model has an adjusted R-squared value higher ($0.8205$) than the first ($0.7798$).


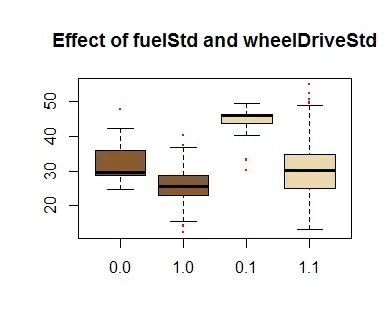
The dichotomous nature of fuelStd and wheeldriveStd simply move the mean of the predicted values down, and in effect are dummy-coded variables or factor. This is also apparent on the initial scatter plot, but can be further visualized with box plots:

enter image description here


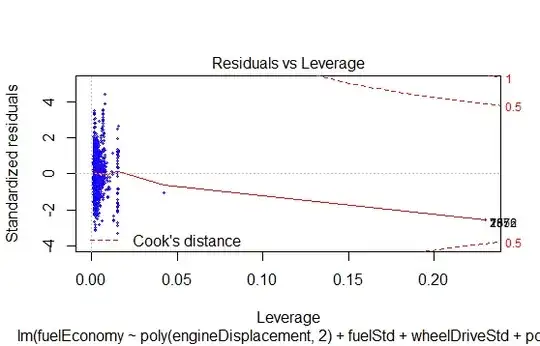
One final point in the diagnostics is the presence of high leverage points, worth looking into:

enter image description here

What to conclude? Nothing categorical. Perhaps just to emphasize the importance of plotting in understanding the data set and any model imposed on it.

Antoni Parellada
  • 23,430
  • 15
  • 100
  • 197
2

The answer to your first question depends on your theoretical framework, how you state the hypotheses about the relationship between dependent and independent variables, and how you interpret the results. On its own, obtaining statistically significant relationship for most of the variables might not say anything about how realistic your results are.

So, if these results look suspicious to you (based on your prior knowledge), you can run some diagnostics tests for regression. There might be a violation of model assumptions and other problems (for instance, outliers). In fact, it is always helpful to run these tests to evaluate your regression model. Since you are using R, you can check car package which provides a number functions for diagnostics tests. Here you can find the course slides on regression diagnostics by one of the authors (and the creator) of car package, John Fox. You can check his book on the topic (1991) as well. Kabacoff (2011) also discussed regression diagnostics and how to use R functions (including those from car package) and interpret results (p.188-200). I think after these diagnostics tests, it is better to evaluate the results and how usable they are.


Fox, J. (1991). Regression Diagnostics. Newbury Park, London, New Delhi: Sage Publications.

Kabacoff, R. I. (2011). R in Action: Data analysis and graphics with R. Shelter Island: Manning.

Also:

Fox, J., & Weisberg, S. (2011). Diagnosing Problems in Linear and Generalized Linear Models. In An R Companion to Applied Regression (2nd ed., pp. 285–328). Los Angeles: Sage Publications.

T.E.G.
  • 1,676
  • 6
  • 16
  • 29