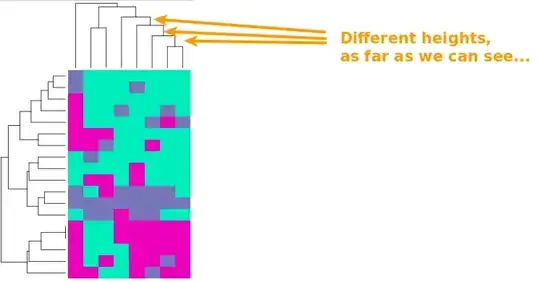
We are trying to interpret a heatmap that looks like this:
... and plotted with this plotting code:
heatmap(ourdata,
    col=cluster_colors,
    distfun = function(x) dist(x, method="euclidean"),
    hclustfun = function(x) hclust(x, method="complete"),
    margins=c(8,18),
);
Visually, it seems quite clear that there are different "heights" between the branches in the dendrogram, which we assume would correspond to relative distances between the columns and/or clusters.
Question 1: Is this correct: do the heights correspond to clustering distances?
Question 2: Where can we find evidence of this? We haven't been able to find the answer from help(heatmap) nor help(hclust) (nor help(dist), although that is not expected either).
