After many months of lurking, this is my first post (fingers crossed).
I have a 'large data' set (~ 5m observations of runs at UK parkrun events) to which I am trying to fit a multilevel model (because of repeated measures from specific runners over time) using R. Here is a quick summary of the variables I am working with:
Outcome: 5k run time (integer in minutes, e.g. 21.5)
Predictors:
gender (two level factor);
age (integer);
previous runs (integer);
friends present during run (integer);
athlete number or athnumber (factor; level 2 random effect in the multilevel model)
Using lmer, I fit a model as follows:
model <- lmer(time ~ gender + age + runs + friends + (1 | athnumber), data = mydata)
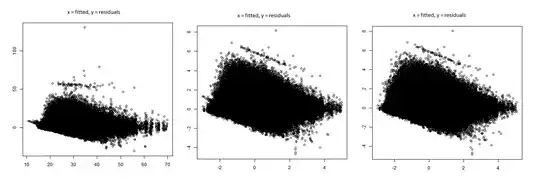
I am concerned with the fitted v. residuals plot that this model produces. With plot(fitted(model), resid(model)) I get the plot on the left below.
Using the same model, log transforming (and scaling) the time variable (which has a positive skew) does not seem to help, in fact it makes it worse (middle plot).
And I get a similar output (the plot on the right) again from the same model if I scale and log transform time, age and the positively skewed predictors (i.e., runs and friends):
For these plots: x = fitted, y = residuals (sorry they're small but I only get two images since I have less than 10 reputation points!)
I have also messed around with trimming the time variable and trimming the age variable, but, if anything, this just makes the fitted v. residual plots look more like diagonal rectangles (i.e., they become less fuzzy, but are still the same shape).
However, if I run a non-hierarchical linear model (with scaled and log transformed versions of time, runs, friends, and age) on a subset of the data obtained from randomly sampling one run from each athlete (thus removing the necessity of including athnumber in a multilevel model), I get a much more reasonable looking fitted v. residual plot. I get the following from model <- lm(time ~ gender + age + runs + friends, mydata) and plot(fitted(model), resid(model)):
So, the lm() seems okay in this regard. But the way I understand it, the multilevel model is predicting time scores that are too fast (positive residuals) for fast runs and time scores that are too slow (negative residuals) for slow runs, is this correct?
So, my questions are: (1) why am I getting this strange-looking fitted v. residual plot for the multilevel model? And (2) surely this means the model is biased and makes any inference invalid, correct? And (3) how can I fix this problem?
Thanks very much for the help and understanding in advance - I'm self-taught with this stuff so please forgive any mistakes. Cheers!

