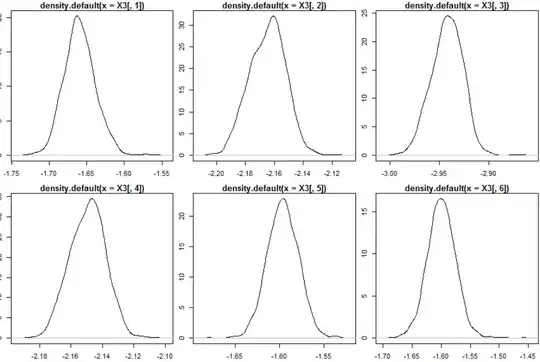
We want to apply PCA to monitor our process testing data. After we plot the density of the testing data and do normality tests, we found them to be definitely not normal, but still symmetrical and long tailed.
What distribution can these be?
If they are not normal, is PCA still be applicable? If not, what other monitoring technique could be used?
We have too many of those testing data, so eyeballing them 1 by 1 is definitely not a good choice.
shapiro test
  ARM_Z  RAMP_Z  DISC_Z RAMP_Z8  ARM_Z1  ARM_Z2
 0.0000  0.0032  0.0000  0.0724  0.0246  0.0000

adf test
  ARM_Z  RAMP_Z  DISC_Z RAMP_Z8  ARM_Z1  ARM_Z2
   0.01    0.01    0.01    0.01    0.01    0.01

jarque-bera test
  ARM_Z.X-squared  RAMP_Z.X-squared  DISC_Z.X-squared RAMP_Z8.X-squared  ARM_Z1.X-squared  ARM_Z2.X-squared
           0.0000            0.4580            0.0003            0.8591            0.0029            0.0000
They are more peaked than corresponding fitted normal distributions.
