2

I have two normal distributions fg and bg with mean (mu) and standard deviations (sd) as follows:

set.seed(100)
fg = rnorm(10000, mean=11.00, sd=3.77)
bg = rnorm(10000, mean=-0.508, sd=1.04)

disros

If I fit an LDA model like this:

library(MASS)
mydata = data.frame(label = c(rep(1, 10000), rep(0,10000)), 
                    score = c(fg, bg))

fit = lda(label~score, data=mydata)

And try and to predict some new values:

newvals = seq(-7, 25, 0.1)
pred = predict(fit, data.frame(score=newvals))

# Plot posterior
matplot(newvals, pred$posterior, type='l', col=c('red', 'blue'), lty=1)

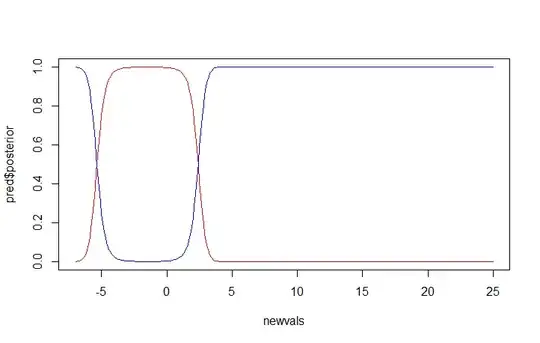
I get posteriors which look like this:

enter image description here

At a value of 5, the posterior for belonging to either class is 0.5, but looking at the density plots above, you can see that at 5 it almost always belongs to the fg distribution. I would expect the posterior to be 0.5 closer to 2.5-3, where both density curves cross eachother.

Can anyone please explain why the lda posteriors are behaving this way - or if I'm doing something wrong?

Thanks!

Omar Wagih
  • 262
  • 4
  • 11
  • 1
    In addition to Flounderer nice answer, read also http://stats.stackexchange.com/a/71571/3277, http://stats.stackexchange.com/a/190821/3277. QDA is the appropriate choice, but LDA could be used as well (read how). – ttnphns Jul 28 '16 at 09:57

1 Answers1

1

This happens because LDA assumes that each of the two classes follows a normal distribution with (possibly) different means, but the same variance. In your case, the class distributions have different variances. In a sense, LDA is approximating the graph in your first figure by a graph in which the red and blue humps have the same width, so you shouldn't expect it to be a very good approximation. You could try QDA instead.

In fact, if you replace lda in your code by qda you get this picture, which is more like what you expected!

enter image description here

Flounderer
  • 9,575
  • 1
  • 32
  • 43
  • Thanks! qda does give me what I expect, minus the fact that at around -5 to -7 the posterior drops for the bg and is and jumps for the fg, whereas I would expect them to remain at 1 (for the bg) and 0 (for the fg), as it did with lda. Is there any reason this is happening? / any way to circumvent this or any other approach I can take? – Omar Wagih Jul 28 '16 at 02:07
  • 1
    The blue curve is actually above the red curve if you go far enough to the left, e.g. `dnorm(-6, mean=11.00, sd=3.77) - dnorm(-6, mean=-0.508, sd=1.04)` is positive, so you will need to choose different functions if you don't want this to happen. – Flounderer Jul 28 '16 at 02:17