I would like to perform wavelet smoothing at different scales in R. I got the idea from this figure (panel A) were they measure the density/intensity of a particular signal at different scales.
Here the image shows the linear coordinates along one chromosome on the x axis and the y axis shows the 'bandwidth' or bin size in which the signal was measured.
Does using wavelets here makes sense?
The first figure comes from de Wit et al. Global Chromatin Domain Organization of the Drosophila Genome, PLoS Genetics 2008.

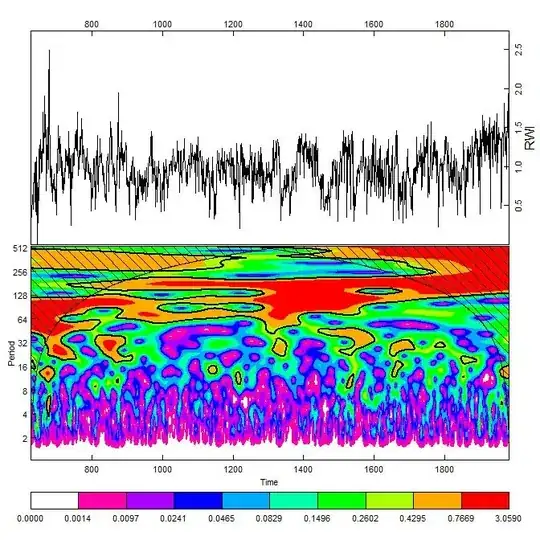
I found this kind of multi-scale wavelet plot but I am not sure if it is reflecting the same thing as the first figure.
This figures comes from this website