11

Since standard error of a linear regression is usually given for the response variable, I'm wondering how to obtain confidence intervals in the other direction - e.g. for an x-intercept. I'm able to visualize what it might be, but I'm sure there must be a straightforward way to do this. Below is an example in R of how to visualize this:

set.seed(1)
x <- 1:10
a <- 20
b <- -2
y <- a + b*x + rnorm(length(x), mean=0, sd=1)

fit <- lm(y ~ x)
XINT <- -coef(fit)[1]/coef(fit)[2]

plot(y ~ x, xlim=c(0, XINT*1.1), ylim=c(-2,max(y)))
abline(h=0, lty=2, col=8); abline(fit, col=2)
points(XINT, 0, col=4, pch=4)
newdat <- data.frame(x=seq(-2,12,len=1000))

# CI
pred <- predict(fit, newdata=newdat, se.fit = TRUE) 
newdat$yplus <-pred$fit + 1.96*pred$se.fit 
newdat$yminus <-pred$fit - 1.96*pred$se.fit 
lines(yplus ~ x, newdat, col=2, lty=2)
lines(yminus ~ x, newdat, col=2, lty=2)

# approximate CI of XINT
lwr <- newdat$x[which.min((newdat$yminus-0)^2)]
upr <- newdat$x[which.min((newdat$yplus-0)^2)]
abline(v=c(lwr, upr), lty=3, col=4)
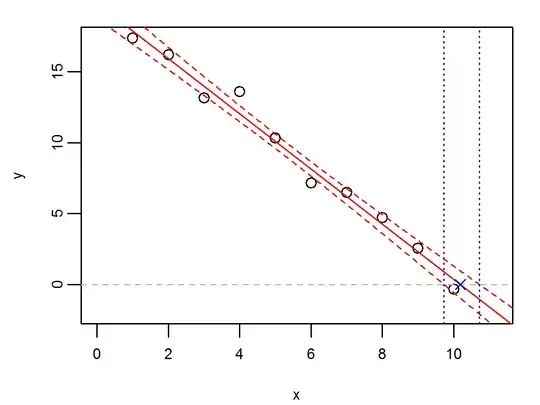
enter image description here

kjetil b halvorsen
  • 63,378
  • 26
  • 142
  • 467
Marc in the box
  • 3,532
  • 3
  • 33
  • 47
  • 1
    You could bootstrap this: `library(boot); sims – Roland Jul 01 '16 at 10:57
  • @Roland - Thanks for this. Very helpful. Any idea why the bootstrap routine produces noticeably narrower intervals than method I show? – Marc in the box Jul 01 '16 at 11:38
  • 1
    What you show in the graph is not the CI for the intercept. You show the points where the lower and upper confidence lines of the predictions cross the axis. – Roland Jul 01 '16 at 11:43
  • Not sure that I understand the issue there - these would seem to be the predicted x-intercepts at the extremes of the coefficient SEs. – Marc in the box Jul 01 '16 at 11:52
  • The points where your blue lines cross the axis are the lower/upper (resp.) confidence limits corresponding to the points where your blue lines cross the prediction line. These are not directly related to the confidence interval of the x intercept. – Roland Jul 01 '16 at 12:01
  • 1
    Often in linear regression one has a model that says something like this: $$ Y_i = \alpha + \beta x_i + \varepsilon_i \quad \text{where } \varepsilon_1,\ldots\varepsilon_n \sim \text{i.i.d. } N(0,\sigma^2), $$so that the $Y$s are treated as random and the $x$s as fixed. That may be justified by saying you're looking for a conditional distribution given the $x$s. In practice if you take a new sample, it is usually not only the $Y$s but also the $x$s that change, suggesting in some circumstances they should also be considered random. I wonder if this bears upon the propriety of$\,\ldots\qquad$ – Michael Hardy Jul 02 '16 at 18:24
  • $\ldots\,$finding a confidence interval for the $x$-intercept? $\qquad$ – Michael Hardy Jul 02 '16 at 18:24
  • 1
    http://stats.stackexchange.com/search?q="inverse+regression" – whuber Jul 03 '16 at 09:11
  • Any chances you could validate my answer? Thanks. – Adrien Renaud Sep 09 '16 at 09:17
  • 1
    @AdrienRenaud - It would seem to me that your answer is overly simplistic given the asymmetric aspects that I mentioned, and are highlighted by the bootstrapping exercise that Roland illustrated. If I'm not asking too much, maybe you could expand on the likelihood approach that you mentioned. – Marc in the box Sep 10 '16 at 13:54
  • You didn't mention the asymmetric aspect in your question and it was not obvious from the figure. So it doesn't really seem fair ;) If your fit procedure return symmetrical confidence interval (ci) on the parameters, then the ci on the intercept will be symmetric. – Adrien Renaud Sep 10 '16 at 16:21
  • @AdrienRenaud - If I didn't elaborate the question fully, I'm sorry about that - I just want to make sure that we have a good canonical answer here. Both my (simplistic) approach and the bootstrapping approach indicate an asymmetric interval, and this seems likely given the assumptions of a linear regression. I will up the ante with a bounty if that motivates :-) – Marc in the box Sep 12 '16 at 15:37
  • I checked your procedure using Neyman construction and a theoretical approach. We still have undercoverage, but increasing the number of data points could maybe solve that issue. Do you want to try with my script? My theoretical approach combined with OLS properties could indicate that your result is optimal. If we have coverage and optimality, we might have a great answer to this question. – Adrien Renaud Sep 15 '16 at 14:49
  • I checked that we have perfect coverage (within 1% statistical uncertainty) when using 100 data points. So we have validity and optimality! The two desired properties of a ci! I have very little time those days to update my answer but I very much like bounty :) – Adrien Renaud Sep 16 '16 at 10:43
  • 1
    @AdrienRenaud - I think you definitely deserve the bounty for your efforts. I finally came across an R package that does inverse regression (investr), but it gives different results. If you're interested, [here's a vignette](https://journal.r-project.org/archive/2014-1/greenwell-kabban.pdf) – Marc in the box Sep 16 '16 at 11:46
  • I have included investr in my little study. It gives same result as MIB and CAPITANI-POLLASTRI with 100 data points (be sure to set `mean.response=TRUE` when calling `calibrate`). For 10 data points, the ci is different and investr coverage is perfect. So investr should be the preferred solution. – Adrien Renaud Sep 16 '16 at 18:36

2 Answers2

10

How to calculate the confidence interval of the x-intercept in a linear regression?

Asumptions

  • Use the simple regression model $y_i = \alpha + \beta x_i + \varepsilon_i$.
  • Errors have normal distribution conditional on the regressors $\epsilon | X \sim \mathcal{N}(0, \sigma^2 I_n)$
  • Fit using ordinary least square

3 procedures to calculate confidence interval on x-intercept

First order Taylor expansion

Your model is $Y=aX+b$ with estimated standard deviation $\sigma_a$ and $\sigma_b$ on $a$ and $b$ parameters and estimated covariance $\sigma_{ab}$. You solve

$$aX+b=0 \Leftrightarrow X= \frac{-b} a.$$

Then the standard deviation $\sigma_X$ on $X$ is given by:

$$\left( \frac {\sigma_X} X \right)^2 = \left( \frac {\sigma_b} b \right)^2 + \left( \frac {\sigma_a} a \right)^2 - 2 \frac{\sigma_{ab}}{ab}.$$

MIB

See code from Marc in the box at How to calculate the confidence interval of the x-intercept in a linear regression?.

CAPITANI-POLLASTRI

CAPITANI-POLLASTRI provides the Cumulative Distribution Function and Density Function for the ratio of two correlated Normal random variables. It can be used to compute confidence interval of the x-intercept in a linear regression. This procedure gives (almost) identical results as the ones from MIB.

Indeed, using ordinary least square and assuming normality of the errors, $\hat\beta \sim \mathcal{N}(\beta, \sigma^2 (X^TX)^{-1})$ (verified) and $\hat{\beta}$'s are correlated (verified).

The procedure is the following:

  • get OLS estimator for $a$ and $b$.
  • get the variance-covariance matrix and extract, $\sigma_a, \sigma_b, \sigma_{ab}=\rho\sigma_a\sigma_b$.
  • Assume that $a$ and $b$ follow a Bivariate Correlated Normal distribution, $\mathcal{N}(a, b, \sigma_a, \sigma_b, \rho)$. Then the density function and Cumulative Distribution Function of $x_{intercept}= \frac{-b}{a}$ are given by CAPITANI-POLLASTRI.
  • Use the Cumulative Distribution Function of $x_{intercept}= \frac{-b}{a}$ to compute desired quantiles and set a cofidence interval.

Comparaison of the 3 procedures

The procedures are compared using the following data configuration:

  • x <- 1:10
  • a <- 20
  • b <- -2
  • y <- a + b*x + rnorm(length(x), mean=0, sd=1)

10000 diferent sample are generated and analyzed using the 3 methods. The code (R) used to generate and analyze can be found at: https://github.com/adrienrenaud/stackExchange/blob/master/crossValidated/q221630/answer.ipynb

  • MIB and CAPITANI-POLLASTRI give equivalent results.
  • First order Taylor expansion differs significantly from the the two other methods.
  • MIB and CAPITANI-POLLASTRI suffers from under-coverage. The 68% (95%) ci is found to contain the true value 63% (92%) of the time.
  • First order Taylor expansion suffers from over-coverage. The 68% (95%) ci is found to contain the true value 87% (99%) of the time.

Conclusions

The x-intercept distribution is asymmetric. It justify a asymmetric confidence interval. MIB and CAPITANI-POLLASTRI give equivalent results. CAPITANI-POLLASTRI have a nice theorical justification and it gives grounds for MIB. MIB and CAPITANI-POLLASTRI suffers from moderate under-coverage and can be used to set confidence intervals.

Adrien Renaud
  • 670
  • 3
  • 8
  • Thanks for this nice answer. Does this method imply that the standard error of the x-intercept is symmetric? The prediction intervals in my figure imply that this is not the case, and I have seen reference to this elsewhere. – Marc in the box Jul 04 '16 at 05:35
  • Yes, it does imply a symmetric interval. If you want an asymmetric one, you could use a profile likelihood treating your model parameters as nuisance parameters. But it's more work :) – Adrien Renaud Jul 04 '16 at 07:36
  • Could you explain more in detail how you get that expression for $(\sigma_X/X)^2$ ? –  Sep 12 '16 at 15:51
  • @fcop It's a Taylor expansion. Have a look at https://en.wikipedia.org/wiki/Propagation_of_uncertainty – Adrien Renaud Sep 12 '16 at 16:01
3

I would recommend bootstrapping the residuals:

library(boot)

set.seed(42)
sims <- boot(residuals(fit), function(r, i, d = data.frame(x, y), yhat = fitted(fit)) {

  d$y <- yhat + r[i]

  fitb <- lm(y ~ x, data = d)

  -coef(fitb)[1]/coef(fitb)[2]
}, R = 1e4)
lines(quantile(sims$t, c(0.025, 0.975)), c(0, 0), col = "blue")

resulting plot

What you show in the graph are the points where the lower/upper limit of the confidence band of the predictions cross the axis. I don't think these are the confidence limits of the intercept, but maybe they are a rough approximation.

Roland
  • 5,758
  • 1
  • 28
  • 60