1

I'm trying to model a logistic regression in R between two simple variables:

  • Rating: An independent ordered categorical one, ranging from 1 to 99 (1, 2, 3, 4, 5, 99 in particular, 1 is the best)
  • Result: A dependent binary variable (0-1, not accepted/accepted)

The formula I use is

glm(formula = result_dummy ~ best_rating, family = binomial(link = "logit"), 
    data = cd[1:10000, ])

result_dummy is a 0/1 numerical variable (original result column was a factor) and scaled_rating is the rating column after use the R scale function.

My thought here was to find a negative correlation (low rating -> more probability to accept) but the more samples I use the more odd results I find:

10 samples:

Coefficients:
              Estimate Std. Error z value Pr(>|z|)
(Intercept)     0.6484     0.7413   0.875    0.382
scaled_rating  -5.9403     5.8179  -1.021    0.307

100 samples:
Coefficients:
              Estimate Std. Error z value Pr(>|z|)   
(Intercept)   -0.09593    0.27492  -0.349  0.72714   
scaled_rating -5.06251    1.76645  -2.866  0.00416 **

1000 samples:

Coefficients:
              Estimate Std. Error z value Pr(>|z|)    
(Intercept)   -0.03539    0.09335  -0.379    0.705    
scaled_rating -6.81964    0.62003 -10.999   <2e-16 ***

10000 samples:
Coefficients:
              Estimate Std. Error z value Pr(>|z|)    
(Intercept)     0.2489     0.0291   8.553   <2e-16 ***
scaled_rating  -7.2319     0.2004 -36.094   <2e-16 ***

Notes: I know that after the fit I should check residual plot, normality assumptions, etc. etc. but nonetheless I find really strange this behaviour.

I also have similar results using simply the rating column instead of the scaled one.

Edit: The rating variable is not really an ordinal one, so as pointed out by @Scortchi maybe it would be better to treat it as a categorical one. I have surely better results and model stability, obviously the model is a simple one and the residual error would be always high (because some variables as not been included in the model). Indeed, including the frequency table as requested shows that the rating variable IS NOT sufficient for having a clear separation between the result outcome.

          0      1
  1    2881  42564
  2   13878 129292
  3   36839 179500
  4   43511  97148
  5   37330  47002
  6   31801  21228
  7   19096   6034
  99  10008      3
Glen_b
  • 257,508
  • 32
  • 553
  • 939
  • 1
    Some points I think need clarifying: (1) What's the purpose of fitting the same model to progressively larger samples? The estimates bounce around a little but does that surprise you? (2) You emphasize that the predictor's ordinal, but then say you've scaled it & fitted a model with a single coefficient for it, which suggests it's interval-scale. What *are* you doing with it? (I'm inclined to guess '99' encodes 'not applicable' or 'missing' & you're treating it as the number 99!) – Scortchi - Reinstate Monica Jun 21 '16 at 16:10
  • 1
    In any case see e.g. [Logistic regression and ordinal independent variables](http://stats.stackexchange.com/q/101511/17230). With plenty of observations the simple approach of treating the predictor as categorical & coding it with dummy variables should also be a good approach. – Scortchi - Reinstate Monica Jun 21 '16 at 16:34
  • 1) The sample is taken from a larger dataset, I expect the larger the sample size the more is similar to the whole dataset (more bias, less variance). My problem is with the abnormal low p-value and an R warning about probability equal to 0 or 1. – Vincenzo Maggio Jun 21 '16 at 17:41
  • 2) the predictor is a evaluation of a guarantee for a loan, yes it's like an interval scale but in reality it's a human evaluation so I don't know if really 2/3 is equal to 1/2, but for now I can assume it is an interval scale. 99 is for bad guarantee, my idea was to have a really large value to drag down the outcome with a negative coefficent. I didn't check if for 99 some loans are accepted, I'll try again tonight excluding those values and not scaling – Vincenzo Maggio Jun 21 '16 at 17:41
  • 1
    Sorry, I forgot to say to *edit your question* to add any pertinent information rather than appending it in comments. Anyway, though your model may well be a poor fit & I suspect you'd be better off treating the predictor as categorical (the '99' is rather arbitrary, & why should the relationship be linear anyway?), nothing you've said *so far* makes your results seem odd in the least. Why shouldn't the p-value be low, & why shouldn't some predictions be equal to or very close to zero? (For the purposes of this analysis, your data can be shown in a 2-by-6 table - you might want to show them.) – Scortchi - Reinstate Monica Jun 22 '16 at 09:39
  • Done. Obviously as you correctly said the model is a simple, basic one and not separable by that single variable (this can be seen by noting that as the rating improves even the chance the loan is accepted is higher, sign that the residual variance includes some effect not taken into account at the moment). In the end I'll go for a SVM to classify cases but it was interesting to try this approach. You may want to collect your comments in an answer to be accepted. – Vincenzo Maggio Jun 22 '16 at 09:55
  • 1
    Somewhat a similar question http://stats.stackexchange.com/q/195246/3277 – ttnphns Jun 22 '16 at 10:06

1 Answers1

2

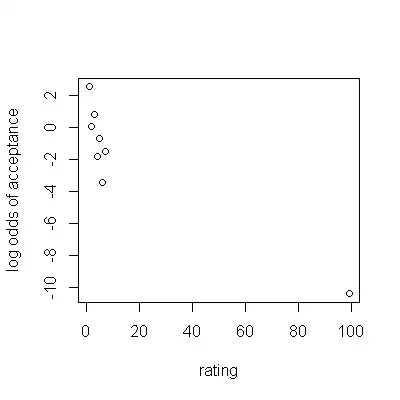
Simply plotting the log odds of acceptance against rating clarifies the issue:

enter image description here

A high odds ratio for an increase of one standard deviation in rating would be expected, as would be a low p-value, given the volume of data; but setting rating to '99' when it's really not available wasn't a good idea - it makes the relationship between rating & log odds far from linear. Using a dummy variable for 'bad guarantee' would have made more sense— see here. Arguably, with plenty of data, there's no need to constrain rating to have a linear relationship with the log odds even over valid values—that the relationship appears non-monotonic is probably more surprising—& you might treat it as categorical.

Scortchi - Reinstate Monica
  • 27,560
  • 8
  • 81
  • 248