This is my first post on this site. I'm a linguistics graduate student who is struggling to grasp the basics of statistics.
I've run a questionnaire in which participants had to rate sentences from 1 (totally unacceptable) to 7 (fully acceptable). I had two different factors with two levels each (a 2x2 design).
Following previous papers whose authors used the same design, I have log-transformed the ratings and then I have calculated z-scores by subject:
dat$rating.log <- log(dat$rating)
dat$z.score.rating2 <- ave(dat$rating.log, dat$subject, FUN=scale)
After that, I've considered ratings above and below 2.5 standard deviations from the mean as outliers and I've removed them (also following previous studies).
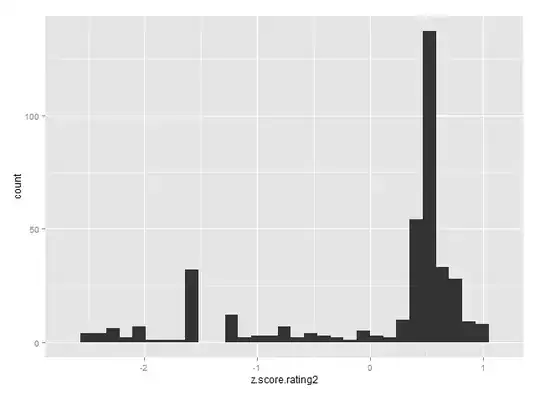
I report here the histogram for the cleaned data:
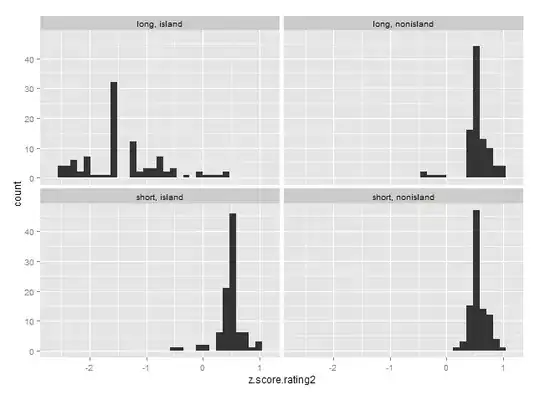
And these are the histograms per condition:
As you can see, the data is far from normal. My question is the following: does this matter if I want to conduct a linear-mixed effects model? If it does, how can I normalize the data?
Thank you very much!

