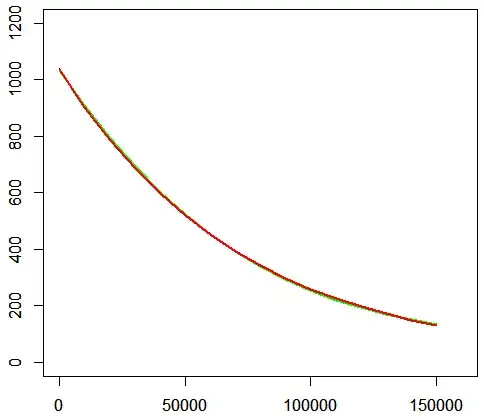
Following code was used to fit a function to my data;
# dataset
x <- c(0,10000,20000,30000,40000,50000,60000,70000,80000,90000,100000,110000,120000,130000,140000,150000)
y <- c(1034,908,794,693,602,523,452,392,339,294,255,221,195,171,152,135)

# visualize dataset
plot(x,y, xlim=c(0,160000), ylim=c(0,1200), pch=".")
lines(x, y,lwd=2, col="green")

# fit model
model <- lm(log(y)~x)
prediction <- exp(predict(model,list(Time=y)))

# visualize model
par(new=T)
plot(x,prediction, xlim=c(0,160000), ylim=c(0,1200), pch=".",xlab="", ylab="")
lines(x, prediction,lwd=2, col = "red", xlab = "Time (s)", ylab = "Counts")
Values created by predict() fit nice to my data;
Following output is created by summary(model);
Call:
lm(formula = log(y) ~ x)

Residuals:
      Min        1Q    Median        3Q       Max
-0.024165 -0.011078 -0.002164  0.009068  0.036583

Coefficients:
              Estimate Std. Error t value Pr(>|t|)
(Intercept)  6.945e+00  7.542e-03   920.9   <2e-16 ***
x           -1.384e-05  8.567e-08  -161.6   <2e-16 ***
---
Signif. codes:  0 ‘***’ 0.001 ‘**’ 0.01 ‘*’ 0.05 ‘.’ 0.1 ‘ ’ 1

Residual standard error: 0.0158 on 14 degrees of freedom
Multiple R-squared:  0.9995,    Adjusted R-squared:  0.9994
F-statistic: 2.61e+04 on 1 and 14 DF,  p-value: < 2.2e-16
As far I'm aware I'm fitting the following model; right?
$\log(y)=X\beta+\epsilon$;
I'm not able to formulate the equation based on above output...
Unfortunately the following (closely related) question did not help me.
How to translate the results from lm() to an equation?
How to formulate the equation? Any help is greatly appreciated! Thanks!
