12

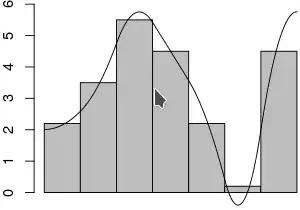
Say I have this binned data as input. The average value $\bar{y}_i$ is given for each successive $\Delta x_i$ interval. For simplicity, let's assume sampling density is uniform within each bin.

Now I want to estimate the underlying function $y$($x$) i.e. I want to be able to get reasonable estimates of $y$ for arbitrary, punctual values of $x$ (e.g. $x$ = 2.3 or 2.5 or whatever). The requirement are:

  1. The function must preserve the average over each bin, $\overline{y(x)}_i = \bar{y}_i$, so as to not introduce bias
  2. The function must be continuous (i.e. no discontinuities)
  3. The function must be non-negative. (Negative values are unphysical.)

Simply looking up the bin value for a given $x$ would satisfy #1, but violate #2 (there are discontinuities at all bin edges).

On the other hand, assigning the entire bin weight to each bin center, and then interpolating between those points, satisfies #2, but violates #1 (regardless of whether it's linear or higher-order spline interpolation). In the illustration below, the 2<$x$<3 bin average is not preserved; it is reduced, as both corners get cut downward.

How can this be done in a way that satisfies both requirements?

Also, what is this operation called? Is this interpolation? (Not sure how to tag this question.)
enter image description here

  • This question is also related to [this question here](https://stats.stackexchange.com/questions/59418/interpolation-of-influenza-data-that-conserves-weekly-mean/). – JedO Jun 07 '20 at 04:31

4 Answers4

3

Here is a paper that describes an iterative method that does what you're asking:

Mean preserving algorithm for smoothly interpolating averaged data

M.D. Rymes, D.R. Myers, Mean preserving algorithm for smoothly interpolating averaged data, Solar Energy, Volume 71, Issue 4, 2001, Pages 225-231, ISSN 0038-092X, https://doi.org/10.1016/S0038-092X(01)00052-4. (http://www.sciencedirect.com/science/article/pii/S0038092X01000524)

Abstract: Hourly mean or monthly mean values of measured solar radiation are typical vehicles for summarized solar radiation and meteorological data. Often, solar-based renewable energy system designers, researchers, and engineers prefer to work with more highly time resolved data, such as detailed diurnal profiles, or mean daily values. The object of this paper is to present a simple method for smoothly interpolating averaged (coarsely resolved) data into data with a finer resolution, while preserving the deterministic mean of the data. The technique preserves the proper component relationship between direct, diffuse, and global solar radiation (when values for at least two of the components are available), as well as the deterministic mean of the coarsely resolved data. Examples based on measured data from several sources and examples of the applicability of this mean preserving smooth interpolator to other averaged data, such as weather data, are presented.

adr
  • 131
  • 6
3

Mean preserving or average preserving splines can be generated from "normal" interpolating splines. Your requirements:

  • $\frac{1}{x_{i+1}-x_i} \int_{x_i}^{x_{i+1}} f(x) \text{d}x = \text{avg}_i$
  • $f\in\text{C}^1$, or at least $f\in\text{C}^0$
  • $f(x)\geq 0$

can be written equivalently by defining the integral $F(x) = \int_{x_0}^x f(t) \text{d}t$:

  • $F(x_{i+1}) = F(x_i) + \text{avg}_i \, (x_{i+1}-x_i)$
  • $F\in\text{C}^2$, or at least $F\in\text{C}^1$
  • $F(x)$ is monotonic

This is now a standard spline interpolation for $F$. In R you could do something like:

avg = c(2.2, 3.5, 5.5, 4.5, 2.2, 0.2, 4.5)
X=0:length(avg)

Y=vector(length=length(X))
Y[0]=0
for(i in 2:length(Y)) Y[i]=Y[i-1]+avg[i-1]*(X[i]-X[i-1])

#s=splinefun(X,Y,method="natural")
#s=splinefun(X,Y,method="monoH.FC")
s=splinefun(X,Y,method="hyman")

Xplot=seq(X[1],tail(X,n=1),by=0.02)
Yplot=s(Xplot,deriv=1)

barplot(avg, space=0,ylim=c(-0.5,6))
lines(Xplot,Yplot)

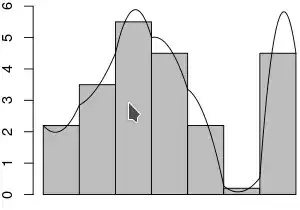
result for s=splinefun(X,Y,method="natural") (not guaranteed positive) spline with method="natural"

result for s=splinefun(X,Y,method="monoH.FC") spline with method="monoH.FC"

result for s=splinefun(X,Y,method="hyman") spline with method="hyman"

  • 3
    For an implementation in C++ see https://kluge.in-chemnitz.de/opensource/spline/#mean_preserv (disclosure: I'm the author) – user1059432 Feb 26 '21 at 17:21
  • the C++ implementation looks amazing. Since I have only used C++ throughout Rcpp, I would like to ask if you believe these C++ functions could by used throughout Rcpp? – Jakub.Novotny Feb 08 '22 at 14:55
0

The best solution I've got so far is to do a linear interpolation between points at bin centers as shown in the graph in the question, after having done a numerical optimisation of all the $y_i$, iterating until condition #1 is met (and with a harsh penalty for violating #3). Unfortunately, numerical optimisation is a bit of a heavier process than I had hoped for.

Instead of doing numerical optimisation, I tried just setting up and solving a set of linear equations. That is really straightforward and quick, but it is not robust against requirement #3: some of the $y_i$ can end up negative, which is nonsensical. Unfortunately, #3 is a non-linear thing and can't be incorporated in the set of linear equations, as far as I can tell.

  • Could you provide any further details about the method you describe "setting up and solving a set of linear equations"? The algorithm described above works well, but it is computationally expensive, requiring at least as many iterations as interpolated timesteps. For a problem not requiring condition #3, is there a way to achieve a means-preserving interpolation that is more efficient than Rymes and Myers (2001)? – JedO Jun 07 '20 at 04:29
  • For _n_ points your function has 2n - 2 parameters (n-1) of ax+b segments. Req #1 provides n equations, and req #2: n-1, total 2n-1. This is overconstrained. Unless you add two more segments covering the extreme halves of the first and the last bins, then you have 2n+2 parameters and 2n-1 equations. Only 3 free parameters. How do you find them? How do you prevent the function from oscillating? – user1079505 Jan 22 '21 at 09:59
-4

Binning is highly discouraged because of inefficiency, discontinuity, and arbitrariness. But you have made the implicit assumption that the bins should be non-overlapping. Making the bins overlap and having many more of them will alleviate some of the problems although regression splines are better.

Don't use bin centers to represent the distribution of $x$ within the bin. Use the mean $x$ within each bin.

Frank Harrell
  • 74,029
  • 5
  • 148
  • 322
  • 6
    I'm not advocating for or against the use of bins, nor for/against having them overlap. I'm saying, this is the data I have to work with. It's my input. I don't have any higher-grade source of information, unfortunately. Also, given the stated simplifying assumption that samples are uniformly distributed within bins, mean *x* will be the same as bin center. – Jean-François Corbett Apr 26 '16 at 12:38