5

I have inter-arrival times of vehicles recorded by a vehicle detection algorithm. I want to find the closest distribution (e.g., Poisson or other) of this data.

How can I do that?

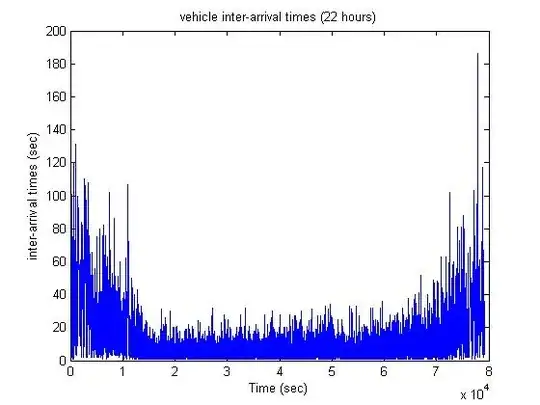
Here is a graph of the inter-arrival times from a crosspost on SO.

enter image description here

umair
  • 51
  • 2
  • 2
    Inter-arrival times are continuous variables, so the Poisson distribution would be a poor choice. You may be thinking of the fact that when inter-arrival times are exponential, the number of events up to a particular point in time has a Poisson distribution. – Macro Jan 05 '12 at 14:51
  • So how do I know the closest distribution? If the draw the graph of this vector (inter-arrival times), it seems to be random. I want to know the closest distribution, so that I may have some level of prediction for the next inter-arrival time. – umair Jan 05 '12 at 14:54
  • Maybe look at a histogram or something. The number of different distributions is not countable, so it's not like you can go through a list and exhaust all possibilities. – Macro Jan 05 '12 at 14:59
  • 3
    The closest distribution to your data is the empirical distribution... Which can be good enough, depending on what you plan to do with it. Tell us more. If you want a "classical" distribution, you have to first decide that you want eg an exponential, then you can fit it to your data. – Elvis Jan 05 '12 at 15:07
  • 2
    I have added the graph from your SO post and also provided a link to the crosspost. It's good to be aware of the general [SE quasi-official policy](http://meta.stackexchange.com/questions/64068/is-cross-posting-a-question-on-multiple-stack-exchange-sites-permitted-if-the-qu) on crossposting. You might flag the post on stackoverflow so it can be merged with this one. – cardinal Jan 06 '12 at 15:53

2 Answers2

5

I'd suggest starting with a quick read of the chapter of Law and Kelton's "Simulation Modeling and Analysis" textbook that discusses methods for selecting distributions to use in Monte Carlo simulations. This chapter discusses methods for selecting candidate distributions, fitting the distributions to your data, and then testing the goodness of fit.

It's quite common to find that many different distributions adequately fit your data. Depending on what you're doing with your model, the choice that you make can have a big effect on the results. In that case, it's appropriate to run your simulation with the different distributions to see how sensitive your results are to the assumed distribution.

For interarrival times, it is nearly always the case in practice that the Poisson process (that is, exponential interarrival times but a Poisson distribution for the number of arrivals in a time period) is the way to go. However, the arrival rate may vary (e.g. by day of the week, time of day, and so on.)

Brian Borchers
  • 5,015
  • 1
  • 18
  • 27
  • (+1) Thanks for the good advice and welcome to our site! – whuber Jan 05 '12 at 15:29
  • (+1) Perhaps you can clarify the second paragraph just a little bit. A superficial reading makes it seem as if the first two sentences are a bit in conflict with one another. (It may be a simple matter of word choice). Some justification for the first sentence in the third paragraph would be welcome. I have found it's quite common in practice *not* to use exponential waiting times. Welcome to the site. – cardinal Jan 05 '12 at 15:36
  • By "adequately fit your data", I mean "pass statistical tests of goodness of fit." It's quite possible for two distributions to pass a goodness of fit test on a sample of a few hundred or event tens of thousands of data points but have the difference between the distributions be significant in the results of a Monte Carlo simulation. The book that I referenced has some good examples of this in its homework exercises. I've also had students gather service time data for simulation projects that fit lognormal, gamma, and exponential distributions simultaneously. – Brian Borchers Jan 06 '12 at 04:24
  • With respect to the last sentence in the third paragraph, my main justification is simply personal experience (working on packet switches in my industrial career, studying the subject in graduate school, and teaching it to students since. I have to admit that this is not my current area of research interest.) I'd also refer you to the discussion of this in the textbook that I cited. Note that I said that arrivals nearly always follow a Poisson process- service time distributions are another story entirely and often aren't exponential in practice. – Brian Borchers Jan 06 '12 at 04:29
  • Some commentors above seem to have missed the important bit of jargon that the original poster didn't get quite right- when arrivals occur according to a Poisson process, the number of arrivals in a fixed time period has a Poisson distribution but the time between successive arrivals has an exponential distribution. This is what is meant when someone says they're assuming "Poisson arrivals." – Brian Borchers Jan 06 '12 at 04:35
  • Thanks for the remarks. They lead in to essentially what I was trying to hint at. Briefly: (1) I suspected this might be what you meant by "adequately...". Unfortunately, I think that the failure to reject the null hypothesis of a GoF test is generally a poor heuristic for deciding that a distribution is appropriate or adequate for modeling and, in fact, inches quite close to a common fallacy; (2) my point regarding the third paragraph was that the statement seems a little broad and might leave the novice (or other reader) with the wrong impression. Certainly, e.g., renewal processes (cont.) – cardinal Jan 06 '12 at 13:22
  • 1
    (cont.) and many variants have a rich theory and plentiful applications. (3) As far as I can tell, I think all the commenters have an acute grasp of the terminology. What I think you'll find as you continue to contribute here (!!) is that one of the main challenges is to tease out the (actual) question of interest and the attendant level at which an answer is to be pitched. One nice thing about this site is that we get questions from a very wide audience; respondents are generally very conscientious about identifying and trying to help clarify points of confusion. – cardinal Jan 06 '12 at 13:29
1

In the spirit of the sage comment by BB "However, the arrival rate may vary (e.g. by day of the week, time of day, and so on.)" , I suggest that you present the data for the 22hours in terms of 22x60 time buckets reflecting the number of arrivals per minute. It might be possible to model this series or a longer series say 7 days X 24 hours x 60 minutes . If daily or hourly patterns are identifiable they might be useful.

IrishStat
  • 27,906
  • 5
  • 29
  • 55
  • That's an excellent recommendation (+1). The special value of the graphic that has been posted--even though it does not reveal the distribution--is that it shows the inter-arrival times are not stationary. This suggests that the requested univariate analysis of their distribution will be uninformative or downright misleading. – whuber Jan 06 '12 at 16:58