21

I am using a classifier which returns probabilities. To calculate AUC, I am using pROC R-package. The output probabilities from classifier are:

probs=c(0.9865780,
0.9996340,
0.9516880,
0.9337157,
0.9778576,
0.8140116,
0.8971550,
0.8967585,
0.6322902,
0.7497237)

probs shows probability of being in class '1'. As shown, the classifier has classified all of samples in class '1'.

True label vector is:

truel=c(1, 1, 1, 1, 1, 0, 0, 0, 0, 0)

As shown, classifier has misclassified 5 samples. But, AUC is:

pROC::auc(truel, probs)
Area under the curve: 1

Could you please explain to me why it happens?
Sycorax
  • 76,417
  • 20
  • 189
  • 313
user4704857
  • 502
  • 3
  • 12

3 Answers3

24

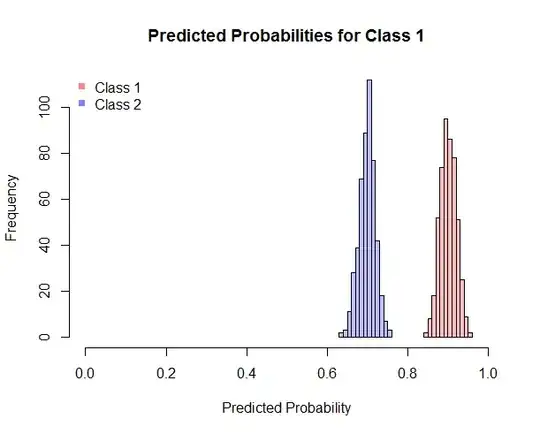
The other answers explain what is happening but I thought a picture might be nice.

You can see that the classes are perfectly separated, so the AUC is 1, but thresholding at 1/2 will produce a misclassification rate of 50%.

probs

jld
  • 18,405
  • 2
  • 52
  • 65
22

The AUC is a measure of the ability to rank examples according to the probability of class membership. Thus if all of the probabilities are above 0.5 you can still have an AUC of one if all of the positive patterns have higher probabilities than all of the negative patterns. In this case there will be a decision threshold that is higher than 0.5, which would give an error rate of zero. Note that because the AUC only measures the ranking of the probabilities, it doesn't tell you if the probabilities are well calibrated (e.g. there is no systematic bias), if calibration of the probabilities is important then look at the cross-entropy metric.

Dikran Marsupial
  • 46,962
  • 5
  • 121
  • 178
22

The samples weren't "misclassified" at all. The 0 examples are ranked strictly lower than the 1 examples. AUROC is doing exactly what it's defined to do, which is measure the probability that a randomly-selected 1 is ranked higher than a randomly-selected 0. In this sample, this is always true, so it's a probability 1 event.

Tom Fawcett has a great expository article about ROC curves. I'd suggest starting there.

Tom Fawcett. "An Introduction to ROC Analysis." Pattern Recognition Letters. 2005.

Sycorax
  • 76,417
  • 20
  • 189
  • 313