0

To compare my method with others I'm trying to compute its AUC but I got a bit confused on how to do this for my case. My method uses a model that classifies an image as class A or B, after that if the image was classified as positive or as A, it goes to a segmentation model that makes a mask showing where class A is located in the image. I need to compute the AUC for the pixel predictions.

So far what I've done is, If the image is discarded by the first model I use its full image prediction for all pixels in that image, otherwise I use the second model's prediction. But the resulting curve was a bit weird and I'm not sure this is the right approach. Is there a better way to do this? Any help is appreciated!

Here's how my ROC curve looks like: enter image description here
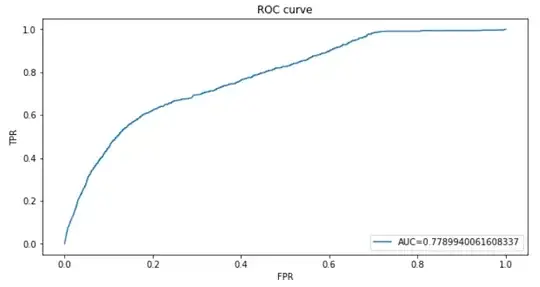
It's weird that in the confusion matrix I made it shows a TPR of 0.91 and a FPR of 0.92 and it does not show that on the curve. I believe it might have a weird behavior because when computing the AUC it's used the same threshold for two different methods, since probabilities come from two models.

  • For a classification problem, the AUC is constructed using the labels for the samples. But since the ground truth is a segmentation mask, it's not clear what the "label" would be in this case. That makes me think you might be using the wrong tool for the job. There are alternative metrics for comparing the "ground truth" mask and the mask generated by a model, such as Jaccard index. Perhaps one of these would be a better choice for your task. – Sycorax Feb 22 '22 at 19:07
  • I use as ground truth pixel labels. It's a binary mask. – Davi Magalhães Feb 22 '22 at 19:11
  • So how are you turning a binary mask, an array of 0s and 1s, into a single 0 or 1 to compute the AUC? – Sycorax Feb 22 '22 at 19:12
  • No, I use an array of pixel probabilities and the mask array to compute the AUC. – Davi Magalhães Feb 22 '22 at 19:14
  • Does each image have its own AUC? Or are you combining the mask & probabilities' AUCs from all images in some way? – Sycorax Feb 22 '22 at 19:15
  • No, it's over the entire dataset, all pixels. – Davi Magalhães Feb 22 '22 at 19:15
  • Oh, I see, your unit of analysis is each pixel. Is that what you're trying to make, a score of whether the model ranks a 1 pixel higher than a 0 pixel? What do you mean when you say "the resulting curve is a bit weird"? Can you post the curve and articulate what, specifically, is "a bid weird"? Please [edit] to clarify. – Sycorax Feb 22 '22 at 19:17
  • I edited the question showing the curve and clarifying. – Davi Magalhães Feb 22 '22 at 19:30
  • You have 2 models and splitting your data into different groups, so you need to be clear about what data you're using to compute the confusion matrix. Moreover, there's no reason to expect the results of a ROC curve and a confusion matrix to agree in general;; they measure different things. See: https://stats.stackexchange.com/questions/200815/why-auc-1-even-classifier-has-misclassified-half-of-the-samples/200819#200819 – Sycorax Feb 22 '22 at 19:32
  • I was clear about using probabilities from two different models, my point is, does it make sense to produce a ROC curve this way? Or could this cause weird behavior because it applies same thresholds for two models? – Davi Magalhães Feb 22 '22 at 19:38
  • I don't see any evidence of weird behavior, but the question seems clear enough to answer, so I'll step back to let people who are more familiar with image segmentation to write answers. – Sycorax Feb 22 '22 at 19:40

0 Answers0