3

I only have a very basic understanding of statistics, but I want to see if the variables consonant, vowel, gender, speaker (as a random effect) have an effect on the Hertz of a vowel. So, Hertz is the dependent variable, and consonant, gender and vowel are the fixed effect. Speaker is a random effect.

I made this model in R: lme(Hertz ~ consonant + gender + vowel, data = df, random =~ 1|speaker)

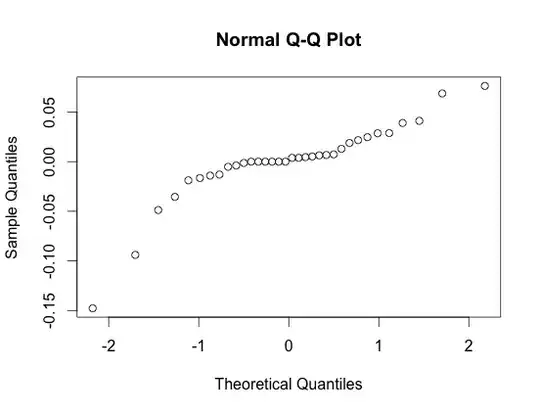
I made a quantile-quantile plot, but the results aren't linear. Do the residuals have to be linear? Here's the plot:

enter image description here

The main thing I want to do is see if the consonant has an effect on Hertz. Could I compare models to see if articulation has an effect? So, compare the log likelihood or AIC or BIC? Or maybe the residual plots? I don't know exactly what these mean, but I think they have something to do with being able to compare models.

lme(Hertz ~ gender + vowel, data = df, random =~ 1|speaker)
usεr11852
  • 33,608
  • 2
  • 75
  • 117
Lisa
  • 163
  • 1
  • 8

1 Answers1

1

Yes you can always compare the AIC (or your favourite IC) between different models given that some basic assumptions hold but I would be very careful about addressing over fitting issues. Your dataset looks rather small dataset to have 3 fixed effects and a random effects.

Check the following thread here: A good intro to computational linguistics? for some books dealing with the analysis of linguistic data. Both books I mentioned have sections specifically dedicated to analysis similar to one you conduct.

For the record your Q-Q plot is not very promising. Do not be disheartened as this is not unsurprising: 1. in most cases phonetic explanatory models do not provide very good fits ($R^2 \geq 0.5$ are basically unheard off), 2. the presence of outliers is almost common place and 3. your sample is rather small so deviations from normality will be more pronounced.

My advise: Get more data.

usεr11852
  • 33,608
  • 2
  • 75
  • 117
  • Thank you! I agree that my data set is small, and my hope is to build more perl code/praat scripts that will get the data automatically for me. However, I need to write up some preliminary results, at least showing how I will model the data. Two follow up questions: 1. How can I tell which AIC number is better? (My two models get -46.1137 and 383.664). 2. If the QQ plot of residuals moves more towards a flat line at y = 0 (as opposed to another QQ plot of a different model), is it a better model for the data? – Lisa Dec 08 '15 at 07:49
  • P.S. I actually have two out of three of the books mentioned in the first comment on the link you posted! Unfortunately, my stats background is rusty and I found/am finding the Baayen book difficult to understand. I'm still working on it, though! – Lisa Dec 08 '15 at 07:58
  • 1. The model with the smallest AIC in this case appears to be massively better. 2. Read through on [this thread](https://stats.stackexchange.com/questions/111010/interpreting-qqplot-is-there-any-rule-of-thumb-to-decide-for-non-normality) on how to use QQ-plots. Regarding both of your questions: Especially the question on AIC shows that you have not researched/refreshed this topic enough. Invest some time on building your basic Stats background. Oh, and maybe avoid Perl if you can, if anything you will be able to get more support in Python. :D – usεr11852 Dec 08 '15 at 08:04
  • Thank you! Do you have a suggestion as to where I should start with my stats background? Maybe a stats text book? – Lisa Dec 08 '15 at 14:33
  • Glad I could help. Depends what you want to do... I think that working through Baayen's and/or Johnson's book should be enough at first given you have a good reference Stats book. Your maths background really makes a difference on what you can access or not. I used [Probability and Statistics](http://www.stat.cmu.edu/~mark/degroot/index.html) by DeGroot and Schervish a lot but it is far from the sole option. – usεr11852 Dec 08 '15 at 19:01