I am working through the concept of the need for normality in the underlying population when performing a t-test. This is nicely expounded by @Glen_b here. The gist of the explanation, I think, is that for the t test to follow a t distribution the numerator, $\bar X-\mu$, must be normally distributed, and also the denominator, $s\over \sqrt n$, is to fulfill the requirement that $s^2 \over \sigma^2$ conforms to a $\chi^2_d$, and be independent (numerator from denominator).
My questions are:
- Can it be shown with a Monte Carlo simulation (e.g., using
R) that a t statistic on sample means extracted from a non-normal distribution doesn't necessarily follow a t distribution? - What would be the repercussions of this for calculating confidence intervals along the lines of the discussion here. Jotting down a likely explanation would be that the issues that apply to the application of a t-test to compare sample means (discussed on the first hyperlinked post) are simply not applicable to sampling distributions as a result of the CLT.
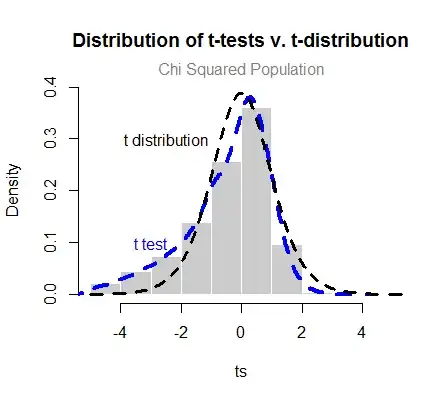
As a way of example of what I'm considering, a possible (probably flawed) approach to the first part of the question would be to extract samples from a $\chi^2_1$. Thanks to the help from the commenters at this point I got this plot with code here:
This is surprising because I expected to see more of a discrepancy between the t-statistic and the t-test based on the underlying population (chi-squared). Although perhaps it should not be surprising at all if we compare it with samples from the almighty Normal, which fit just so:
So is the offset in the first plot "clearly" off? Is it fair to compare it to the normal? Just side questions, the actual points I am asking are clearly stated above.
EDIT: If there is no official answer, I want to at least reflect here the valuable tip offered by @Scortchi in the comments to illustrate how real the offset is:
The 0.5% quantile for the t-test statatics generated in the simulation quantile(ts, 0.005) = -9.682655, whereas qt(0.005, df=9) = -3.249836.

