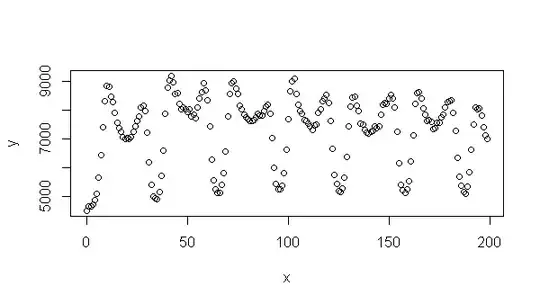
I have an oscillating variable which I'd like to fit.
dput(df2)
structure(list(x = 0:199, y = c(4519.3335, 4658.6113, 4658.5,
4738.8335, 4875, 5111.5, 5656.1113, 6432.1113, 7406.5557, 8320.833,
8822.1113, 8797.3887, 8470.333, 8269, 7917.9443, 7549.1113, 7388.5557,
7235.3335, 7055.3887, 6986.5557, 7033.5, 7006.4443, 7062.6665,
7246.7778, 7449.9443, 7620.2778, 7786.5557, 8083.7222, 8143.6113,
7971.8887, 7216.1113, 6194.7778, 5408.9443, 4990.1665, 4951.7222,
4924.0557, 5166.7222, 5716.3887, 6601.2778, 7885.8887, 8772.2773,
9028.167, 9173.833, 8977.0557, 8542.5, 8599.7773, 8221.667, 8029.1113,
8091.2778, 8031.6113, 7940.8887, 8014.6113, 7776.4443, 7850.1665,
7712.9443, 8092.8887, 8395.5, 8612.1113, 8919.2773, 8694.1113,
8328.167, 7422.4443, 6288.9443, 5574.2222, 5260.8887, 5128.1113,
5123.0557, 5411.4443, 5809.4443, 6570.5557, 7763.8335, 8550,
8934.7227, 8995.9443, 8746.3887, 8545.2227, 8145.2222, 8017.3887,
7844.3335, 7745, 7686.9443, 7631.9443, 7625.4443, 7643.1113,
7751.0557, 7859.3887, 7806.7778, 7821.8887, 7957.2778, 8129.2222,
8167.5557, 7885.3335, 7024.4443, 5996.4443, 5429.6665, 5250.7222,
5247.6665, 5382.3335, 5806.0557, 6610.8335, 7690.7778, 8657.333,
8998.833, 9074.167, 8557, 8174.8335, 7974.6665, 7871.7778, 7668.9443,
7635.1113, 7515.0557, 7430.1665, 7305.8887, 7461.7778, 7502.5,
7913.6665, 8022.4443, 8317.5, 8406.7773, 8538.333, 8244.8887,
7636.7778, 6641.5, 5768.3887, 5439.9443, 5179.6113, 5146.7222,
5291.2778, 5647.9443, 6364.5, 7423.1113, 8120.3887, 8432.3887,
8450.167, 8157.3335, 7952.1113, 7542.5557, 7506.1113, 7299.2222,
7217.0557, 7182.3335, 7239.5557, 7278.6665, 7430, 7367.1113,
7431.1665, 7835.3335, 8191, 8238.9443, 8205.6113, 8385.833, 8531.333,
8400.4443, 8074.2778, 7247.0557, 6153.6665, 5423.5, 5225.5557,
5118.6665, 5263.0557, 5519.5, 6208.3335, 7134.0557, 8220.6113,
8594.1113, 8611.5, 8409.2773, 8066.6665, 7853.3887, 7617, 7667.6665,
7576.2778, 7349.3335, 7388, 7573.2222, 7550.4443, 7746, 7848.9443,
8074.4443, 8266.7773, 8313.167, 8329.7227, 7904.7778, 7277.3335,
6336.1665, 5679.3887, 5384.8887, 5151.5, 5093.2778, 5348.2222,
5840.3887, 6633.1113, 7482.6665, 8080.6113, 8038.3335, 8053.5557,
7809.7778, 7401.1665, 7130.3335, 6986.5)), .Names = c("x", "y"
), row.names = c(NA, 200L), class = "data.frame")
I have tried a sinusoidal fit like the one shown here but the output is not good because it does not take into account the difference in oscillation amplitude. I was using
reslm2 <- lm(y ~ sin(2*pi/per*t)+cos(2*pi/per*t)+sin(4*pi/per*t)+cos(4*pi/per*t))
`where` t<-df2$x `and` y<-df2$y
I would like to have predicted values for the 200:300 range.
Maybe using some loess function or changing the function used for lm
