5

I got a time series dataset from the lab and would like to fit my data to a curve (using R package): $$ P_{1}(t)=y_{0}-a_{1}e^{-b_{1}t}-a_{2}e^{-b_{2}t}, b_{2}>b_{1} \tag{A} $$

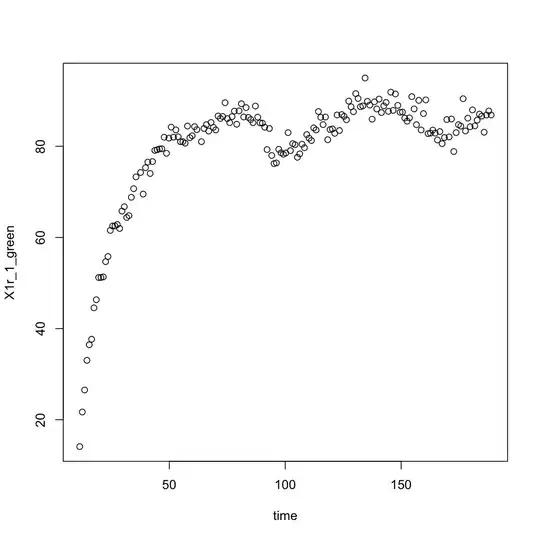
I plotted the data:

enter image description here

I think I need to start with good initial values to get a better estimate when fitting to the curve.So I start with a simpler curve: $$ P_{2}(t)=a_{1}e^{-b_{1}t} \tag{B} $$

and I got:

Call:
lm(formula = log(P1_1) ~ time)

Coefficients:

(Intercept)        time  
   4.084148        0.002703 

That is, $a_{1}=54, b_{1}=0.003$ (roughly).

So I set the starting value $y_{0}=30, a_{1}=20, b_{1}=0.002, b_{1}=30, b_{2}=0.003$ and then did:

nls_fit <- nls(X1r_1_green~-y0+A1*exp(tau1*Time)+A2*exp(tau2*Time), 
               start=list(y0=35, A1=20, A2=30, tau1=.02, tau2=.03), data=data1, trace=T)

However, it returns errors that I could not figure out how to fix, such as:

step factor 0.000488281 reduced below 'minFactor' of 0.000976562
singular gradient matrix at initial parameter estimates

After digging into some posts online, the error might be the poor initial values. After many times attempts at different initial values I've still had no luck, though. Do you have any suggestions?

The data is as follows:

       Time X1r_1_green
1    11.333     14.1060
2    12.443     21.6894
3    13.450     26.5231
4    14.457     33.0356
5    15.463     36.4517
6    16.471     37.6585
7    17.478     44.5417
8    18.485     46.3301
9    19.492     51.2111
10   20.499     51.2094
11   21.505     51.3405
12   22.513     54.6848
13   23.520     55.8172
14   24.527     61.5436
15   25.534     62.5158
16   26.541     62.5279
17   27.547     62.8395
18   28.555     61.9790
19   29.562     65.7806
20   30.569     66.7353
21   31.576     64.3837
22   32.583     64.7834
23   33.589     68.8058
24   34.597     70.6975
25   35.604     73.2809
26   37.597     74.2578
27   38.707     69.5155
28   39.714     75.3023
29   40.721     76.5360
30   41.727     74.0348
31   42.735     76.6561
32   43.742     79.1025
33   44.749     79.2463
34   45.756     79.4334
35   46.763     79.4644
36   47.769     81.9903
37   48.776     78.4627
38   49.784     81.7913
39   50.791     84.2073
40   51.798     82.0027
41   52.805     83.6003
42   53.811     82.0862
43   54.818     80.9991
44   55.826     81.0088
45   56.833     80.6877
46   57.840     84.4431
47   58.847     81.8827
48   59.853     82.3165
49   60.861     84.3172
50   61.868     83.6584
51   63.862     81.0175
52   64.972     83.9112
53   65.979     84.7511
54   66.986     83.3383
55   67.993     85.2289
56   68.999     84.1657
57   70.007     83.5959
58   71.014     86.6437
59   72.021     86.1192
60   73.028     86.5437
61   74.034     89.5566
62   75.041     86.0854
63   76.049     85.1923
64   77.056     86.5120
65   78.063     87.7273
66   79.070     84.8408
67   80.076     87.7706
68   81.083     89.3330
69   82.091     86.4411
70   83.098     88.4944
71   84.105     86.3283
72   85.112     85.8619
73   86.118     85.1758
74   87.125     88.8349
75   88.133     86.4028
76   89.140     85.1487
77   90.147     85.0808
78   91.154     84.1891
79   92.160     79.2782
80   93.167     83.9142
81   94.175     77.9845
82   95.182     76.1993
83   96.189     76.3565
84   97.196     79.3567
85   98.202     78.5809
86   99.210     78.2514
87  100.217     78.5353
88  101.224     82.9957
89  102.231     79.0445
90  103.237     80.5854
91  104.244     80.3490
92  105.252     77.5888
93  106.259     78.3460
94  107.266     80.4607
95  108.273     79.6868
96  109.279     82.5708
97  110.287     81.7843
98  111.294     81.2645
99  112.301     84.0419
100 113.308     83.5896
101 114.315     87.6291
102 115.321     86.3707
103 116.329     84.7563
104 117.336     86.4180
105 118.343     81.4442
106 119.350     83.6793
107 120.357     83.8090
108 121.363     82.8488
109 122.371     86.8810
110 123.378     83.4640
111 124.385     86.9706
112 125.392     86.5779
113 126.398     85.8226
114 127.406     89.9185
115 128.413     88.6702
116 129.420     87.5920
117 130.427     91.5657
118 131.434     90.5003
119 132.440     88.6852
120 133.448     88.8704
121 134.455     94.9899
122 135.462     89.8719
123 136.469     89.0472
124 137.477     85.9579
125 138.483     89.7549
126 139.490     88.1925
127 140.497     90.3598
128 141.504     87.4038
129 142.511     88.8794
130 143.518     89.6318
131 144.525     87.6712
132 145.532     91.8890
133 146.539     87.8800
134 147.546     91.4838
135 148.553     88.9816
136 149.560     87.4804
137 150.567     87.5171
138 151.574     86.1898
139 152.581     85.5146
140 153.588     86.2422
141 154.595     90.9029
142 155.602     88.2005
143 156.609     84.7370
144 157.616     90.0859
145 158.623     83.5787
146 159.630     87.1796
147 160.637     90.1887
148 161.644     82.7800
149 162.651     82.8887
150 163.658     83.5638
151 164.665     82.8934
152 165.672     81.3959
153 166.679     83.2340
154 167.686     80.5834
155 168.693     81.9224
156 169.700     85.8687
157 170.707     82.0637
158 171.714     85.9917
159 172.722     78.8532
160 173.728     83.0037
161 174.735     84.7516
162 175.742     84.4288
163 176.749     90.4443
164 177.757     83.3640
165 178.764     86.1808
166 179.770     84.2887
167 180.777     87.9906
168 181.784     84.4754
169 182.791     85.7398
170 183.798     87.0640
171 184.805     86.6323
172 185.812     83.0898
173 186.819     86.8609
174 187.826     87.7454
175 188.833     86.8763
Glen_b
  • 257,508
  • 32
  • 553
  • 939
Liz Sugar
  • 153
  • 1
  • 1
  • 4
  • 2
    Asking for code / help with error messages is off topic here. But are you sure you have the right model? (That isn't off topic here.) Why not just fit a spline? – gung - Reinstate Monica Oct 10 '15 at 17:02
  • @Liz maybe you should specify why you want to fit this model. Do these parameters have any interpretations? Given the plot, this model does not look like a good choice. – Gumeo Oct 10 '15 at 17:45
  • @Gung and Guðmundur Einarsson, thanks for your time. the model is coming from this paper: http://www.ncbi.nlm.nih.gov/pubmed/25540829. My advisor asked me to use the model suggested in that paper. I told my advisor the question I ran into (as described), he told me to keep working on it. However, I tried all I can do but no luck. I heard about nonlinear regression but have never used it before. Starting from zero, and 10 days I only got this far. I'm wondering if I did something due to lack of statistician intuition and training that I didn't realize it.... – Liz Sugar Oct 10 '15 at 18:04
  • my question is not limited to the error given by R, it is more like is there any approach I can take to fit the data to that model, or is there any suggestion about what step I should take next based on my work. May I know why this model is not a good choice for the given data? Thank you! – Liz Sugar Oct 10 '15 at 18:06
  • If you post the data I can show you how to solve it. – dave fournier Oct 10 '15 at 18:18
  • @davefournier, I just have the data posted. Thanks in advance. – Liz Sugar Oct 10 '15 at 18:41

4 Answers4

5

enter image description here

I wish I had a dollar for every hour people have wasted trying to do nonlinear parameter estimation with R.

Here is the solution to your problem together with the estimated std devs calculated by the delta method and plot of solution is above.

y0 85.557909  3.0989e-01

a1 125.20943 1.3766e+01

a2 1394.155 4.4952e+03

b1 0.062640298 4.1774e-03

b2 0.43392314 2.9936e-01

I used the same AD Model Builder code as I posted there, but modified slightly for your problem. As I stated there this is a general technique for attacking these sorts of problems.

How to choose initial values for nonlinear least squares fit

This is the AD Model Builder code for your problem.

DATA_SECTION
  init_int n
  int mid
 !! mid=75;
  init_matrix data(1,n,1,3)
  vector t(1,n)
  vector P(1,n)
 !! t=column(data,2);
 !! P=column(data,3);   //use column 3
  number tmax
  number Pmax
 !! tmax=max(t);
 !! Pmax=max(P);
 !! t/=tmax;
 !! P/=Pmax;

PARAMETER_SECTION
  init_number L1(3)     //(3) means estimate in phase 3
  init_number Lmid(3)
  init_number Ln(3)

  vector L(1,3)
  init_number log_b1       // estimate in phase 1
  init_number log_diff    // estimate in phase 2 
  sdreport_number b1
  sdreport_number b2
  matrix M(1,3,1,3);
  objective_function_value f
  sdreport_vector v(1,3)
  sdreport_number real_y0
  sdreport_number real_a1
  sdreport_number real_a2
  sdreport_number real_b1
  sdreport_number real_b2
  vector pred(1,n);
PROCEDURE_SECTION
  L(1)=L1;
  L(2)=Lmid;
  L(3)=Ln;
  b1=exp(log_b1);    // this parameterization ensures that b1<b2
  b2=b1+exp(log_diff);  
  M(1,1)=exp(-b1*t(1));
  M(1,2)=exp(-b2*t(1));
  M(1,3)=1;
  M(2,1)=exp(-b1*t(mid));
  M(2,2)=exp(-b2*t(mid));
  M(2,3)=1;
  M(3,1)=exp(-b1*t(n));
  M(3,2)=exp(-b2*t(n));
  M(3,3)=1;

  v=solve(M,L);  // solve for standard parameters 
                 // v is vector corresponding to the parameters b_1 b_2 P_0

  pred=v(3)-v(1)*exp(-b1*t)-v(2)*exp(-b2*t);
  if (current_phase()<4)
    f+=norm2(P-pred);
  else   // use concentrated likelihood so that Hessian is correct
    f+=0.5*n*log(norm2(P-pred)); //concentrated likelihood

  real_y0=v(3)*Pmax;
  real_a1=v(1)*Pmax;
  real_a2=v(2)*Pmax;
  real_b1=b1/tmax;
  real_b2=b2/tmax;

REPORT_SECTION
  dvar_matrix tmp(1,2,1,n);
  dvar_vector real_t=t*tmax;
  dvar_vector real_pred=real_y0-real_a1*exp(-real_b1*real_t)
    -real_a2*exp(-real_b2*real_t);

  tmp(1)=real_t;
  tmp(2)=real_pred;

  ofstream ofs1("pred");
  ofs1 << trans(tmp)<< endl;

  tmp(2)=P*Pmax;

  ofstream ofs2("obs");
  ofs2 << trans(tmp)<< endl;


  report << "y0 " << setprecision(8) << real_y0 << endl;
  report << "a1 " << setprecision(8) << real_a1 << endl;
  report << "a2 " << setprecision(8) << real_a2 << endl;
  report << "b1 " << setprecision(8) << real_b1 << endl;
  report << "b2 " << setprecision(8) << real_b2 << endl;
dave fournier
  • 606
  • 5
  • 12
  • wow!! it's quite something I need to digest a little bit, good to my long weekend. :) Thank you so much! I just googled and learned that AD builder is a software built for nonlinear regression. thanks a million!! – Liz Sugar Oct 10 '15 at 20:51
2

EDITED TO REMOVE THE ORIGINAL SECOND POINT, WHICH WAS WRONG. Two comments:

  1. Looking at the data, something strange is happening at about 80 seconds and 140 seconds. If these are experimental artefacts, then it won't make sense to fit a complicated model. If those data show a real trend (not an experimental artefact), then you'll need a sinusoidal model to fit those twists and bends. Fitting the biexponential model assumes all variation is Gaussian, but those trends at 80 and 140 seconds seem too large to just be random variation.

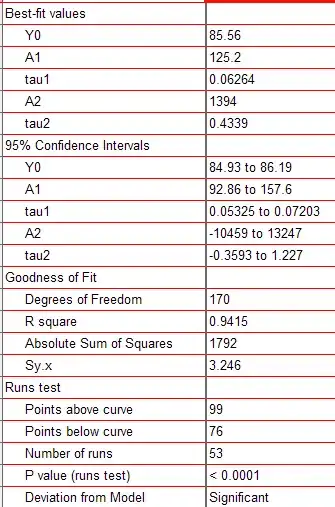
  2. Here are the results from GraphPad Prism, which are very similar to those that Dave got with ADBuilder (Prism file):

enter image description here

a. Look at the confidence intervals for A2 and tau2. They cross into negative values, which are impossible, and are quite wide. Your data really don't define these parameters.

b. The P value from the runs test is tiny. This means that the data systematically deviate from the curve. Whether a point is above or below the curve is not entirely random. This goes along with point 1 above.

c. If you try to extrapolate the curve down to Time=0, the Y values get very negative. Depending on the scientific context, this may suggest the model is not very sensible. Perhaps the model should include a (X - X0) term, where X0 is a constant (maybe 11.33, your first time point)?

Harvey Motulsky
  • 14,903
  • 11
  • 51
  • 98
  • yes I fit transformed data, but then I transformed them back to produce the plots. I carefully did this all in the REPORT_SECTION to make sure I did not mix apples with oranges. Anyway I'm happy to answer any objections you may have. – dave fournier Oct 10 '15 at 23:53
  • In my original posting, my second point was completely wrong. I had said that the equation with Davr's parameters didn't follow the shape of the data. My mistake. I omitted a minus sign). I've removed that point entirely, and replaced with other comments. – Harvey Motulsky Oct 11 '15 at 00:58
  • @Harvey, thanks so much for the comments. By looking at Harvey's comment, especially the confidence interval. Actually I tried to use NLIN procedure in SAS, and it gave me large CI as well, however, estimates with such huge variation doesn't make sense to me. – Liz Sugar Oct 11 '15 at 02:26
  • Regarding comment 2c, good point! I've never considered the extrapolate issue. It might be another way to handle it by subtracting the baseline value from each observed value, and then fit the model. – Liz Sugar Oct 11 '15 at 02:30
2

NB in my discussion, I'll ignore the obvious lack of fit of the model and focus on the issues with getting estimates.

A model like this one can sometimes have a few issues (because of a ridge in the parameter space) but there seems to be no such difficulty here.

I did a one-exponential fit first, as you did. Then the very first two-exponential fit I tried worked.

Here's what I did, in order:

First, I tried plotting curves for a few values for y0, a1 and b1 until I found something that worked okay:

Step 0: find some values for a one-exponential model by trial and error

#Leaving out the values I tried that didn't work as well, I got to here:
 plot(X1r_1_green~Time,data1)
 t=10:189
 f1=90-100*exp(-0.05*t)
 lines(t,f1,col=4)

Step 1: fit a one-exponential model:

fit1exp=nls(X1r_1_green ~ y0-a1*exp(-b1*Time),
                   data=data1,start=c(y0=90,a1=100,b1=.05))
summary(fit1exp)

Formula: X1r_1_green ~ y0 - a1 * exp(-b1 * Time)

Parameters:
    Estimate Std. Error t value Pr(>|t|)    
y0 8.542e+01  3.007e-01  284.11   <2e-16 ***
a1 1.447e+02  7.140e+00   20.26   <2e-16 ***
b1 6.804e-02  2.707e-03   25.13   <2e-16 ***
---
Signif. codes:  0 ‘***’ 0.001 ‘**’ 0.01 ‘*’ 0.05 ‘.’ 0.1 ‘ ’ 1

Residual standard error: 3.271 on 172 degrees of freedom

Number of iterations to convergence: 4 
Achieved convergence tolerance: 3.197e-06

Step 2: Shrink those a little toward 0, put in rough guesses for the second parameter set (I made them in the ballpark of 15-20% of the first set, but it pays to be imprecise about this):

 fit2exp=nls(X1r_1_green~ y0-a1*exp(-b1*Time)-a2*exp(-b2*Time),
                  data=data1,start=c(y0=80,a1=120,b1=.06,a2=20,b2=.01))

 summary(fit2exp)

Formula: X1r_1_green ~ y0 - a1 * exp(-b1 * Time) - a2 * exp(-b2 * Time)

Parameters:
    Estimate Std. Error t value Pr(>|t|)    
y0 8.771e+01  1.205e+01   7.281 1.18e-11 ***
a1 1.509e+02  9.122e+00  16.539  < 2e-16 ***
b1 7.379e-02  7.828e-03   9.427  < 2e-16 ***
a2 5.132e+00  6.504e+00   0.789    0.431    
b2 6.429e-03  3.356e-02   0.192    0.848    
---
Signif. codes:  0 ‘***’ 0.001 ‘**’ 0.01 ‘*’ 0.05 ‘.’ 0.1 ‘ ’ 1

Residual standard error: 3.261 on 170 degrees of freedom

Number of iterations to convergence: 22 
Achieved convergence tolerance: 4.992e-06

I did not expect that second model to work first try; usually you'd have to fiddle about a bit with a model like that one (or even better, use subject area knowledge to build better guesses -- but I don't have any of that).

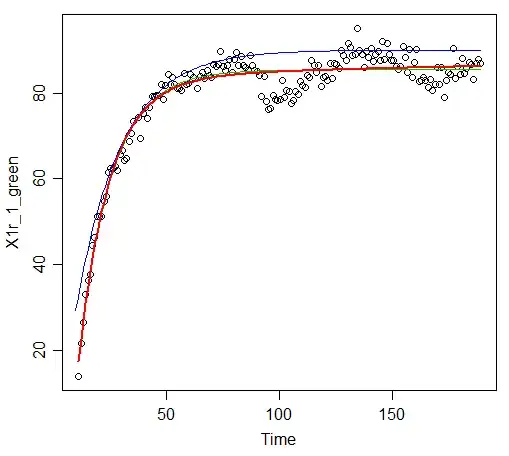
Plotting that fit on the same plot as the initial fit:

enter image description here

Original by-eye fit of single exponential in blue, final two-exponential nls-fit in red. There's also a single-exponential nls-fit in green, but it's almost entirely overlapped by the red curve -- i.e. the second exponential adds almost nothing to the fit here.)

I spent longer editing your post than I did getting that fit working, and most of that was simply finding the blue curve by eye.

[While this seemed to work just fine, it definitely does pay to try other starting values and see whether you've converged to a local optimum, or perhaps got stuck in a really stretched out ridge and ended up some distance from where you might be. I'd normally try changing the default convergence criteria as well.]

Glen_b
  • 257,508
  • 32
  • 553
  • 939
  • thanks for helping me. So happy to know that R also works. I was planning to install AD Builder and just had my laptop upgrade to meet the minimum requirement for AD Builder installation last night. I think I could play with this two to finish my task. there are like 30 datasets like the posting one that need to be fitted to the model. Thank you! – Liz Sugar Oct 11 '15 at 14:12
  • Fortunately there is an objective way to measure the quality of fits to the data. For your fit the residual sum of squares can be calculated by – dave fournier Oct 11 '15 at 15:04
  • Fortunately there is an objective way to measure the quality of fits to the data. For your fit the residual sum of squares can be calculated by > sum(resid(fit2exp)^2) [1] 1807.572 I refitted the data using nls with my solution as the starting values. fit3exp=nls(X1r_1_green~ y0-a1*exp(-b1*Time)-a2*exp(-b2*Time), data=data1,start=c(y0=85.557909,a1=125.20943, b1=0.062640298,a2=1394.1548,b2=0.43392313)) > sum(resid(fit3exp)^2) [1] 1791.52 So your fit had not really converged. I would not rely on nls. – dave fournier Oct 11 '15 at 15:13
  • I should also add that I generated my starting values automatically without looking at the data. – dave fournier Oct 11 '15 at 15:20
  • @davefournier, thanks for the comments. the question for how good is a good fit just came to my mind, and I saw your comment. :) In addition, I'm so happy to know ADMB, it is the highlight of this weekend!! – Liz Sugar Oct 11 '15 at 16:23
  • @Liz Sugar If you want help with ADMB you should post on the AD Model Builder user's list and I will assist you. – dave fournier Oct 12 '15 at 17:38
0

If you realize that your model is partial linear, the whole task gets very simple. You only need starting values for the non-linear parameters and since these are related to the half-life, it's easy to make a decent guess from a plot:

tau1_ini <- log(2) / 18            
tau2_ini <- log(2) / 180

Then you can fit:

fit <- nls(X1r_1_green ~ cbind(1, exp(-tau1 * Time), exp(-tau2 * Time)), 
           data = DF, algorithm = "plinear", 
           start = list(tau1 = tau1_ini, tau2 = tau2_ini))

summary(fit)

#Formula: X1r_1_green ~ cbind(1, exp(-tau1 * Time), exp(-tau2 * Time))
#
#Parameters:
#        Estimate Std. Error t value Pr(>|t|)    
#tau1   7.379e-02  7.828e-03   9.427  < 2e-16 ***
#tau2   6.429e-03  3.356e-02   0.192    0.848    
#.lin1  8.771e+01  1.205e+01   7.280 1.18e-11 ***
#.lin2 -1.509e+02  9.122e+00 -16.539  < 2e-16 ***
#.lin3 -5.132e+00  6.505e+00  -0.789    0.431    
#---
#Signif. codes:  0 ‘***’ 0.001 ‘**’ 0.01 ‘*’ 0.05 ‘.’ 0.1 ‘ ’ 1
#
#Residual standard error: 3.261 on 170 degrees of freedom
#
#Number of iterations to convergence: 19 
#Achieved convergence tolerance: 6.29e-06

That's the same result as in @Glen_b's answer.

Note that the parameter estimates are strongly correlated. You data doesn't really support such a complex model.

Roland
  • 5,758
  • 1
  • 28
  • 60
  • However as I demonstrated above this is not the correct answer. nls is just not up to solving this problem reliably. – dave fournier Oct 12 '15 at 14:30
  • 1
    @davefournier That's a strong statement. Different optimizers can give different results. Also, you could set `control = nls.control(tol = 1e-7)` to reduce the sum of squares slightly to 1807.572, but that has no important impact on the parameter estimates. I would rather say, that the data doesn't really support a 2-pools-model. – Roland Oct 12 '15 at 15:18
  • The correct sum of squares at the minimum is 1791.52 not 1807.572. – dave fournier Oct 12 '15 at 15:36
  • I don't think you should use the word "correct" here. What you claim might be the global optimum (something to prove). However, looking at the data it would probably be even more "correct" to include variance and autocorrelation structures in the model or even to exclude data after `Time`s of about 90 because something unexpected is going on after that. Unfortunately, the model includes already too many parameters as it is. The size and decay of the second pool can not really be estimated with any good accuracy and a single-pool-model should be used. – Roland Oct 12 '15 at 17:41
  • Of course you can not easily prove that a solution is the global minimum. but you can prove that a solution is not the global minimum by exhibiting a better solution. Your solution was not the global minimum. It seems to be a common characteristic of R users that when their software fails to find the correct answer, they blame the data. I agree that the parameters are badly determined for this data set. That is why you need a more robust routine than nls. – dave fournier Oct 12 '15 at 17:48
  • 1
    @davefournier and I could write such a routine with R (as you have done with your rather lengthy code). The point is that doing so is a waste of time. One should use a different model. – Roland Oct 13 '15 at 09:29