I am examining the reliability of a measuring device by measuring a force generated på test persons 7 days apart using R.
In order to assess this properly I want to make a Bland & Altman plot that takes into account that it is the same device I am using to perform the measurements. As I understand, in this case a regular Bland & Altman plot is not correct to plot. So I have trid to use the MethComp package. My data looks like this:
I have ten subjects (Id) doing the measurent once (Rep), at two different timepoints (Method)
First I form a meth object:
vag4 <- Meth(vkextlong,
             meth = "Method",
             repl = "Rep",
             item = "Id",
             y = "y")
and then run the ba.plot
BA.plot(vag4,
        model = "linked",
        axlim = c(0,1000),
        diflim = c(-240,170))
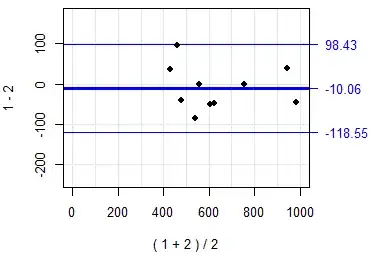
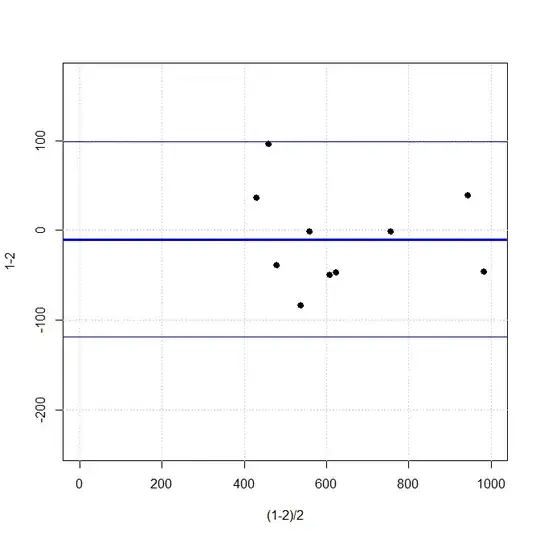
Which gives me this plot
However I am in doubt if it is correct: 1. Is the data set up correctly? 2. Is it correct to use the "linked" method?
Any experts on this out there?


