I am using R for this analysis, and so examples and graphics will be produced in this language. I am willing to provide equivalent examples in similar languages if it will help someone, and am willing to accept answers in terms of other languages.
In this question, I intend to display graphs produced in order to verify assumptions, and ask for help in getting a better model. I understand that this may be considered too specific. However, it is my opinion that it would be helpful to have more examples of bad models and how to correct them on this site. If a moderator finds this not to be the case, I will happily delete this post.
I have conducted an initial linear model (lm) in R. It is multiple categorical regression with approx 100,000 cases, two categorical regressors and a continuous regressand. The goal of this regression is prediction: specifically, I would like to estimate prediction intervals. Find below some diagnostics of the initial model:
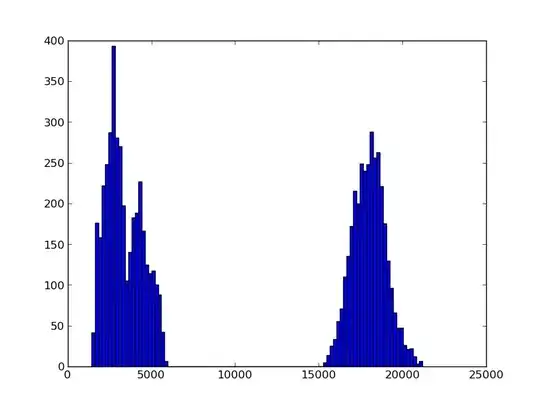
Residuals histogram (full) below. It may be difficult (impossible) to see, but there exist (sparse) values between 300 and 2000, as well as -50 and -500. Between -50 and 300, values are very dense. This indicates, to my understanding, heavy tails.
Residuals histogram (partial) below. Same image as above, but zoomed to the dense area.
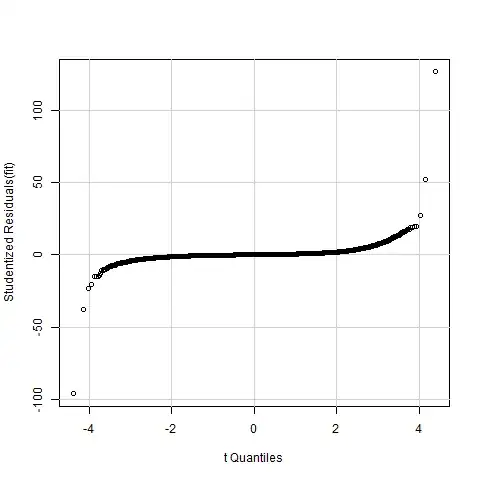
A normal Quantile Quantile (normal QQ plot) is found below. Again, according to the holy grail of qqplots, (super) heavy tails are indicated.
Below is predicted vs residuals. Clearly, funky stuff is going on, suggesting heteroscedasticity:
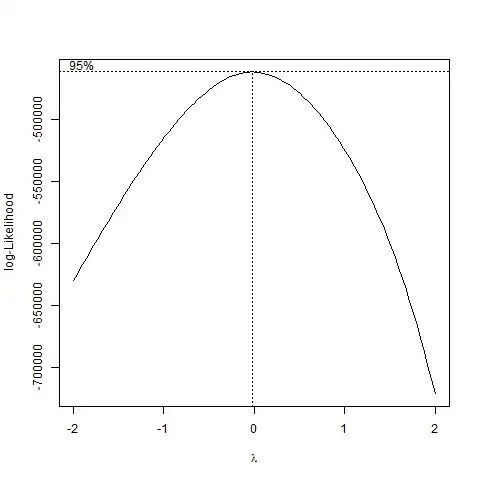
I first tried some transformations. BoxCox yields a value very close to zero. So I will try to take the log of the regressand (in accordance with the Wikipedia page).
Log Transform:
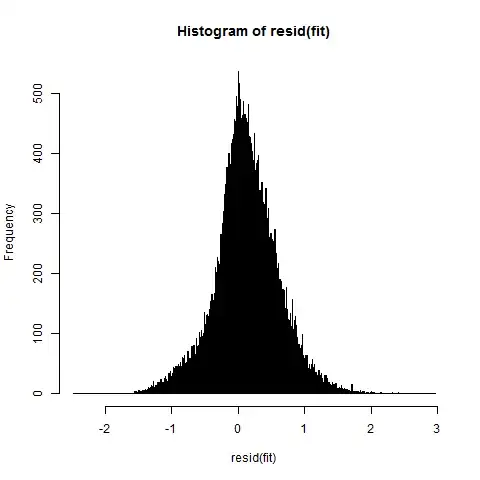
Log transformed histogram, looks a lot better, but we still have some skew:
And the NormalQQ Plot. Still seems that the residuals are not normally distributed.
Logarithm transformed Residual vs Predicted. Seems we have some decreasing variance now, but I would be willing to accept this assumption.
Other transformations I tried: raising regressand to powers 1/2, 1/3 and -1. None of these had satisfactory results; I choose not to include information about these transformations in order to save space, but will happily provide such information should it be requested.
Here lie my questions:
1) Is the solution to this problem simply to keep trying increasingly wacky transformations (ex: $1/log(x^{\pi/3})$)?
2) I have been looking (intermittently over a period of weeks) at Generalized Linear Models, which seem to allow a non-normal distribution of residuals. Unfortunately, I have not been able to understand them, and non of my (undergraduate statistics) peers have knowledge of them. If GLM's present a solution to this issue, I would be grateful if someone could explain them in this context. (Even if they are not a solution, I would be grateful for a simple explanation, or a reference to one).
2i) If GLM's are a good fit, I believe I would still need a distribution to model error by. What ways are there of detecting which (family) of distribution is the best fit for the residuals, after which I assume I can perform MLE to get the parameters? I've been having issues trying to evaluate heavy tailed distributions with respect to skew, because they tend not to have any moments, and so have $\infty$ or indeterminate skew.
3) Is there another class of models not aforementioned I should look into?
4) Is my current model sufficient for prediction intervals, despite the non-normality of residuals?
Some more information about the model: I am predicting a cost, thus the log transform is appealing in that my predicted values are positive reals.
I will be hanging around my computer all day, and have R gui open on my other monitor, so should be able to fulfill most requests for additional information.
