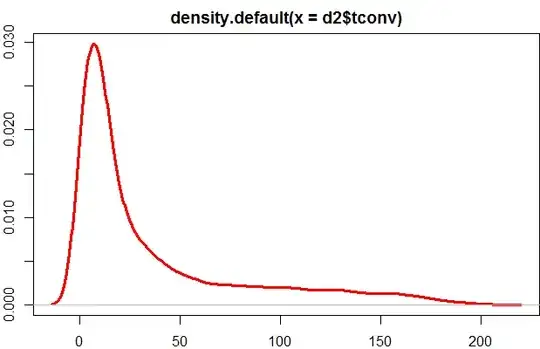
With more than $7,\!000$ observations, you are probably safe to use the proportion of observations at a given value as an estimate of the probability of drawing that value at random from the population. This will probably work fine up until the far right tail of your sample. If you wanted to smooth the estimates, you could use a moving window of, say, $\pm 1$ and re-scale. The downside here is that your last few values will probably not be well estimated, and of course you cannot get probabilities for values beyond your maximum observed value.
Another approach, which amounts to the same thing, is to use the Kaplan-Meier estimator. This will give you the survival function, which is one minus the CDF of your distribution. Subtracting the values from one and differencing them gets you to the same place as above.
Bootstrapping is fine as an addition to the above, but it isn't really a nonparametric estimate of the population probability mass function. Instead, you are taking your sample as an estimate of the population PMF (see here). What bootstrapping will do is let you estimate the uncertainty of your estimated probability from the procedure above. This will probably work reasonably well, but will certainly work less well for those values where you have less data (i.e., the far right tail again).
To extrapolate to probabilities for values that don't show up in your dataset (i.e., x values above your max), you will need to fit a parametric distribution. Even if you did get a good fit, this is still a somewhat sketchy endeavor though, in that you can never know if you used the right distribution. To check the goodness of fit, you can compare the values from the fitted parametric distribution to the values calculated above. If you can live with that uncertainty, you want to look at distributions for count data. The default count distribution is Poisson, but your data are too spread out for that to be viable. The first thing I would look at is the negative binomial distribution, which can handle greater variance and has the advantage of being the distribution of the number of heads before a specified number of failures occurs. That is, it is a distribution of durations for count data, which sounds a lot like your situation. If you use R, ?fitdist in the fitdistrplus package can help you fit distributions like the negative binomial to your data.
