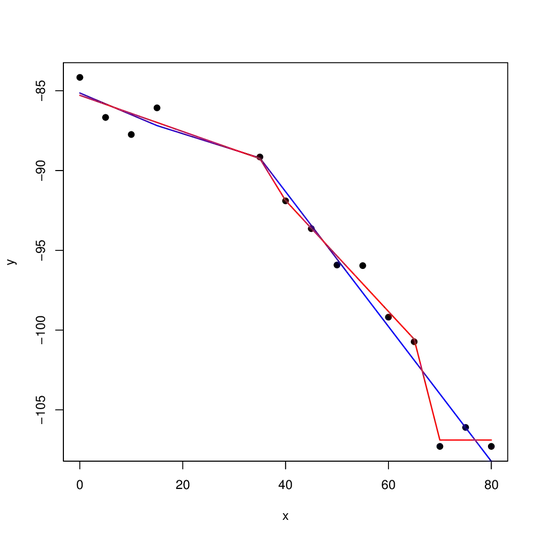
I've been playing around with the package strucchange (and to some extent segmented) in R. I'm trying to determine whether there are changes in slope in a linear regression and more importantly, how many breakpoints. A toy dataset:
x <- c(0, 5, 10, 15, 35, 40, 45, 50, 55, 60, 65, 70, 75, 80)
y <- c(-84.16, -86.67, -87.74, -86.07, -89.15, -91.90, -93.64, -95.92,
  -95.96, -99.19, -100.73, -107.29, -106.10, -107.29)
First problem: if I use the breakpoints function:
breakpoints(y ~ x, data = data.frame(x, y))
I get the following error:
Error in breakpoints.formula(y ~ x, data = data.frame(x, y)) :
minimum segment size must be greater than the number of regressors
I think this arises because the default h parameter in the breakpoints command is 0.15 and 14 (the number of observations I have) * 0.15 = 2.1 which, rounded down, is not greater than 2 (the "number of regressors": incidentally, I would have thought the number of regressors would be 1 given my formula but I've learned from other working examples of y ~ x that nreg = 2 in these cases. I guess the intercept counts as a regressor?).
If I set h to 3 or some fraction such that 14 * h >= 3, the command works.
breakpoints(y ~ x, data = data.frame(x, y), h = 3)
Two breakpoints are returned. But the result is sensitive to h. Such that if I use:
breakpoints(y ~ x, data = data.frame(x, y), h = 4)
I get a different solution. In the latter case, a single optimal break is found because the minimum number of observations before a break can be called is higher. Is there a way to somehow determine whether one solution has more support than the other? In other words, how best to optimize not the position of breakpoints, but the number of breakpoints (perhaps across values of h)? I think the Fstats command might be the key but I'm having a lot of trouble understanding the help for this command...
