What R package (*) is able to create interactive graphics like these but allowing to export it to pdf?
http://www.intmath.com/counting-probability/normal-distribution-graph-interactive.php
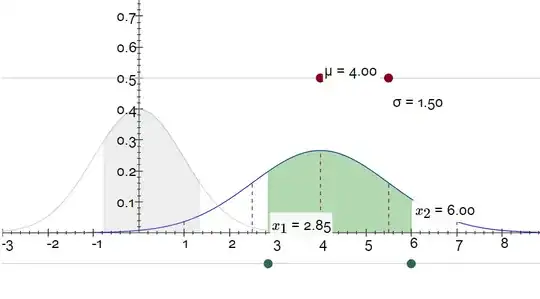 http://www.measuringu.com/normal_curve.php
If yo go to the link you can scroll the green points and see how the graph changes.
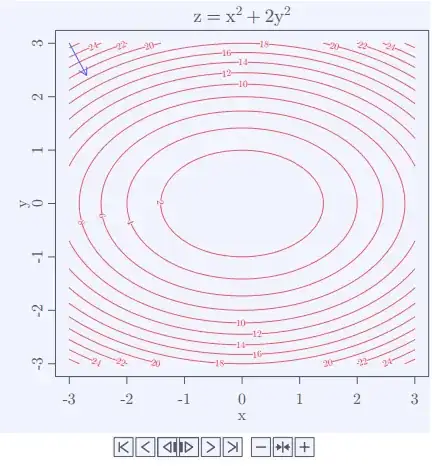
The package 'Animation' allow to create animations and export them to pdf but as far as I know it only allow to create a sequential animation, it doesn't allow to select anything inside the graph and the only scroller it allows is the simple arrow under the graph.
I know there are other packages that allow some interaction, such as: rgl, ggvis, WebGL, iplots or sendplot, but I think none of them allow to export to pdf.
Any idea on how to get it?
(*) Combining any package and an external tool would also be useful.